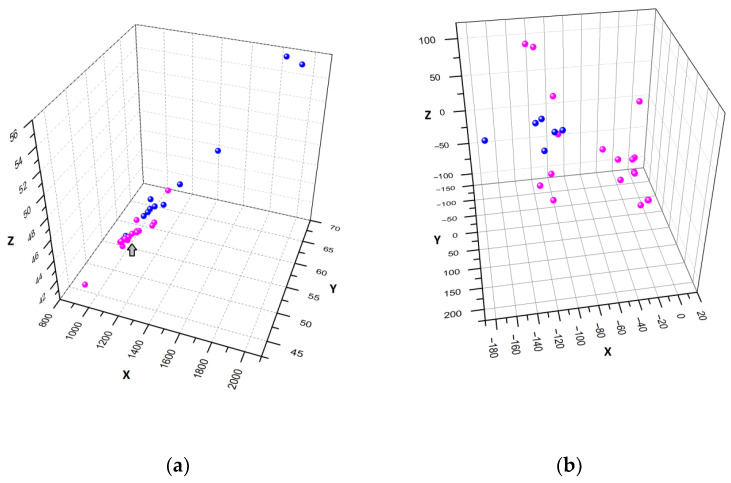
Figure 6.
Three-dimensional representation of α-amylase inhibitors (purple spheres) and mucin-inhibitory domains (blue spheres) from sea anemones. (a) A 3D scatter plot of sequence coordinates prepared by the NULA algorithm. Magnificamides’ locations are shown by the arrow. (b) A 3D scatter plot of the coordinates of the superimposed molecules’ dipole moments.

