Figure 1.
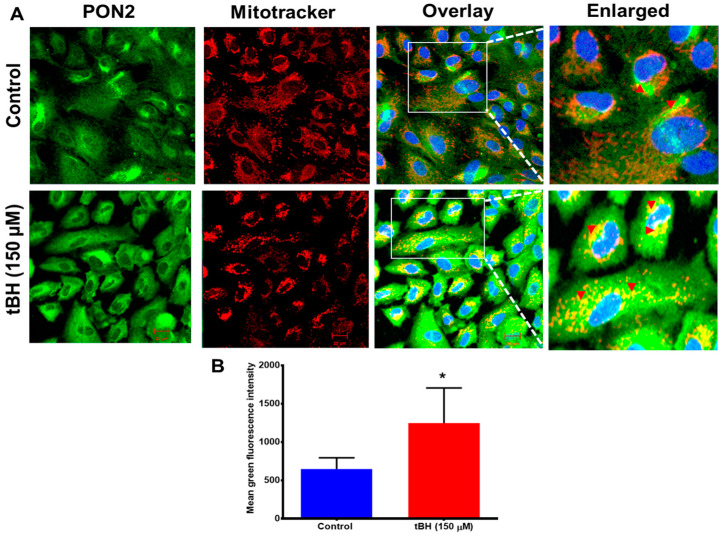
PON2 colocalizes with mitochondria in RPE cells. (A) Primary cultured human RPE cells were treated with tBH (150 µM) for 4 h and double-stained with PON2 (green) and mitochondrial tracker (red). Nuclei were stained with DAPI (blue). Colocalization is visualized by yellow staining in the overlayed and enlarged images for PON2 and mitochondria in RPE cells (arrowheads). Compared to untreated control cells, the colocalization in tBH-treated cells appeared to be more pronounced (mean ± SD, n = 8–10). (B) Fluorescence intensity for PON2 was measured using Zen 2011 software. Scale bar: 20 μm. * p < 0.05.

