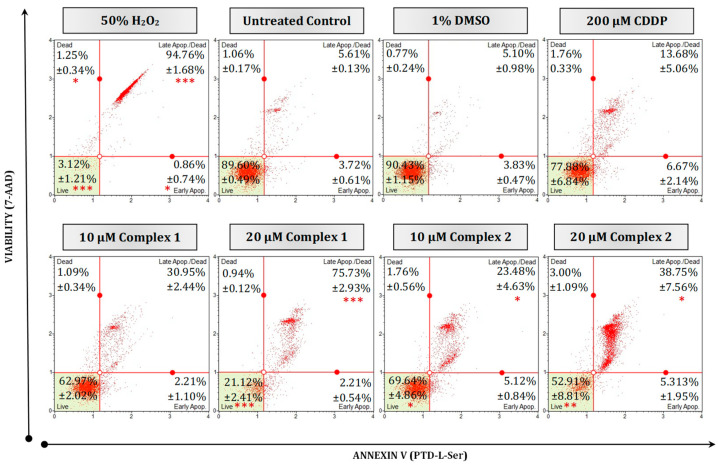
Figure 5.
Mode of cell death in malignant HT-29 cells quantified using a Muse® Annexin V and Dead Cell kit. Representative flow cytometry dot plots are presented as 50% H2O2 (positive necrotic control), untreated, treated with 1% DMSO, 200 µM CDDP, 10 µM and 20 µM of complexes 1 and 2 for 24 h. Averaged percentages were calculated and are shown within the dot plots followed by the ±SEM (n = 3). Asterisks indicate significant differences between treatments and 1% DMSO for each representative quadrant (* p < 0.05; ** p < 0.01 and *** p < 0.001). Co-detection of Annexin V (Ptd-L-Ser) and 7-AAD indicate apoptosis or necrosis, respectively. The red dots indicate cell populations within a sample. Cells in the live quadrant (bottom left) are viable, non-apoptotic and negative for Annexin V and 7-AAD. Cells in the early apoptotic quadrant (bottom right) are positive for Annexin V only, while the late apoptotic/dead quadrant (top right) represents cells that are positive for Annexin V and 7-AAD. The dead quadrant (top left) represents mostly nuclear debris and are cells positive for 7-AAD only.

