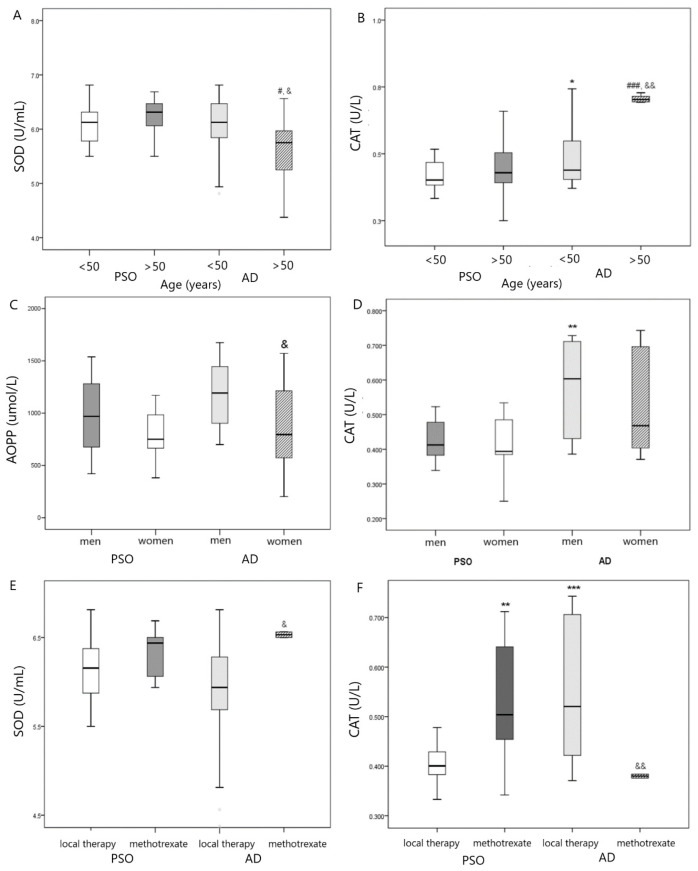
Figure 1.
(A) Comparison in SOD activity in PsO vs. AD group according to age, # p < 0.05 vs. PsO > 50 years; & p < 0.05 vs. AD <50 years; (B) Comparison in CAT activity in PsO vs. AD group according to age, * p < 0.05 vs. PsO < 50 years; ### p < 0.001 vs. PsO > 50 years; && p < 0.01 vs. AD < 50 years; (C) Comparison in AOPP level in PsO vs. AD group according to gender, & p < 0.05 vs. AD men; (D) Comparison in CAT activity in PsO vs. AD group according to gender, ** p < 0.01 vs. PsO men; (E) Comparison in SOD activity in PsO vs. AD group according to therapy, & p < 0.05 vs. AD with local therapy; (F) Comparison in CAT activity in PsO vs. AD group according to therapy, ** p < 0.01, *** p < 0.001 vs. PsO with local therapy; && p < 0.01 vs. AD with local therapy.

