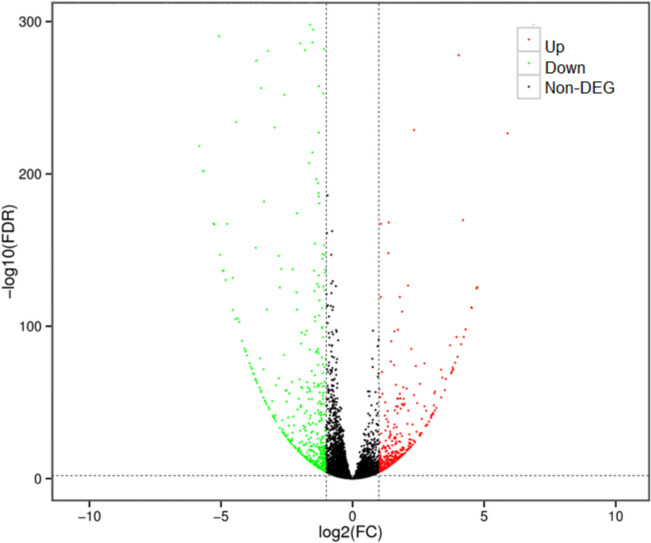
Fig. 6.
Volcano map of differentially expressed genes between control and triple mutation plants. Note: Each point in the volcano map represents a gene, and the abscissa represents the logarithm of expression fold change of a gene in the two samples. The ordinate represents the negative logarithm of the statistical significance of the change in gene expression. The greater the absolute value of abscissa, the greater the difference of expression multiple between the two samples. The larger the ordinate value, the more significant the differential expression, and the more reliable the differentially expressed genes screened. A fold change (FC) ≥ 2 and false discovery rate (FDR) < 0.01 was used to identify DEGs. Up or down-regulated genes refer to those in the Z4 triple mutant relative to WT control plants. Green dots represent down regulated differentially expressed genes, red dots represent up regulated differentially expressed genes, and black dots represent non differentially expressed gene (non-DEG)

