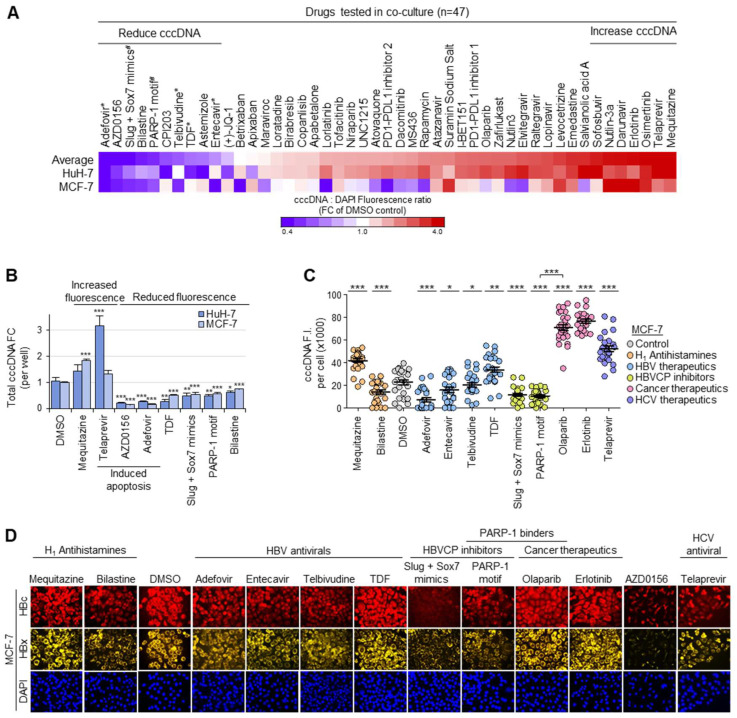
Figure 4.
Fluorescence screen for cccDNA-targeted therapeutics. (A) Heatmap showing normalized cccDNA fluorescence relative to DAPI fluorescence 48 h post-drugs (n = 47, 10 μM) in HuH-7 and MCF-7 acceptor cells. Drugs that significantly increased cccDNA (mean fold-change > 3.5, n = 7) or reduced cccDNA accumulation (mean fold-change < 0.8, n = 10) relative to DMSO control in both HuH-7 and MCF-7 were selected for validation. * Clinical HBV therapeutics; # pre-clinical HBVCP inhibitors. (B) Effect of selected drugs via qPCR for total amount of cccDNA per well in independent experiments (n = 3, mean ± S.E.M.). *** p < 0.001, ** p < 0.01, * p < 0.05. (C) Validation of changes to normalized cccDNA fluorescence in drug screen by quantifying cccDNA-specific fluorescence in nuclei of MCF-7 48 h after drug treatment. (n = 25, mean ± S.E.M.). *** p < 0.001, ** p < 0.01, * p < 0.05. (D) Representative images corresponding to protein expression of HBc (red) and HBx (yellow) 48 h post-drug-treatment in MCF-7.

