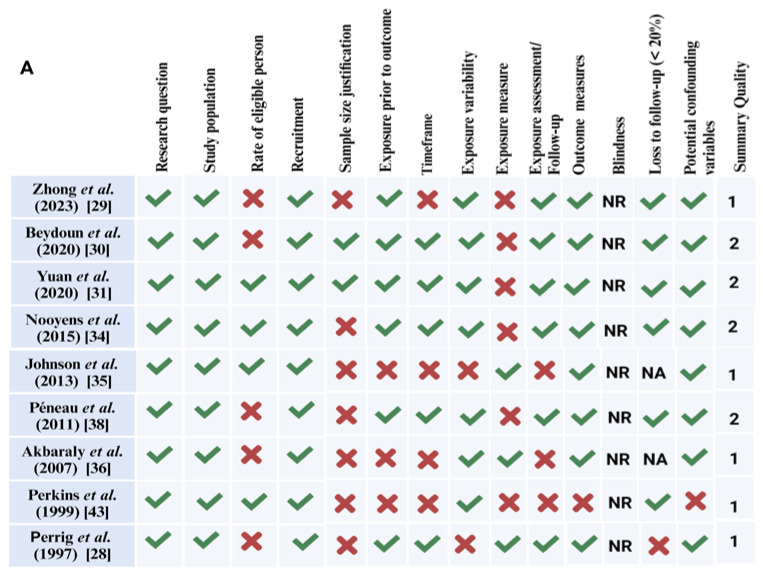
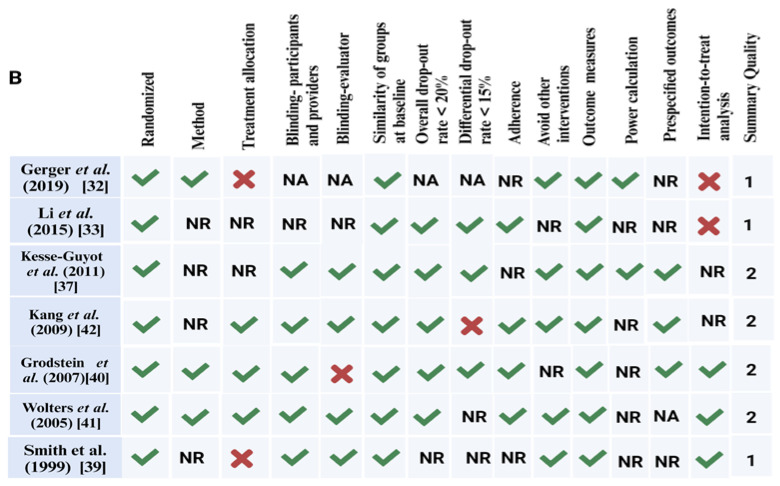
Figure 4.
(A) Summary of risk-of-bias assessment according to the National Institutes of Health Quality Assessment Tool for Observational Cohort and Cross-Sectional Studies (NIH, 2014) [44]. (B) Summary Quality Assessment according to Health Quality Controlled Intervention Studies (NIH, 2014). The quality rating is 0 for poor (0–4 out of 14 questions), 1 for fair (5–9 out of 14 questions), or 2 for good (>10 out of 14 questions) [28,29,30,31,32,33,34,35,36,37,38,39,40,41,42,43]. NA: not applicable, NR: not reported; created with BioRender.


