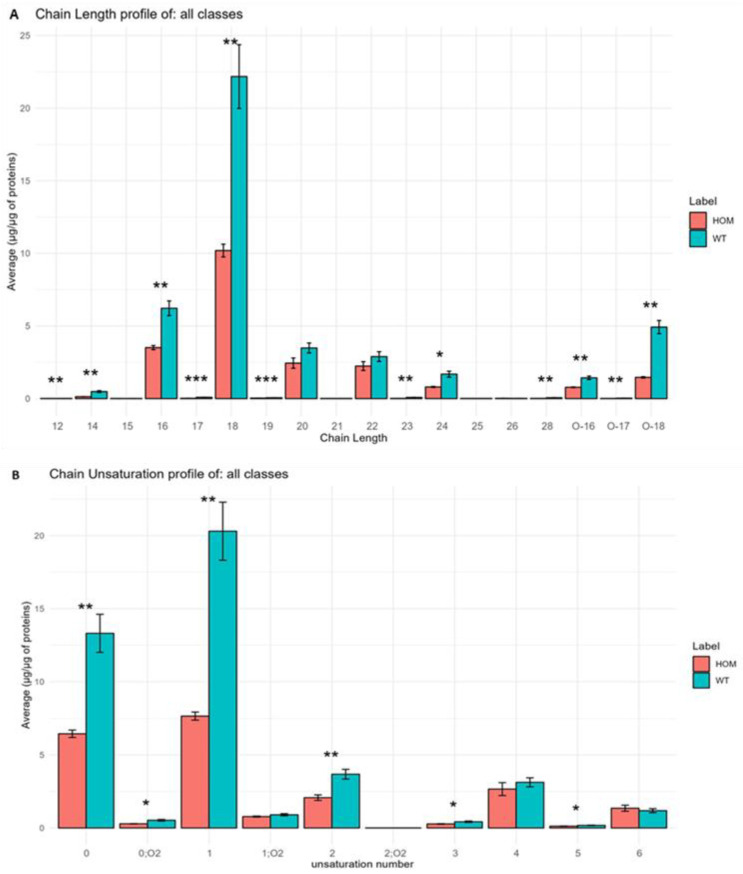
Figure 8.
(A) Histograms obtained using LipidOne represent the results of the analysis at the level of fatty acid chain length in SN tissue in the HOM group compared to WT group. (B) Histograms obtained using LipidOne represent the results of the analysis at the level of chain unsaturation in HOM group compared to WT group. Asterisks represent p-values following t-test (* p < 0.05, ** p < 0.01, *** p < 0.001).

