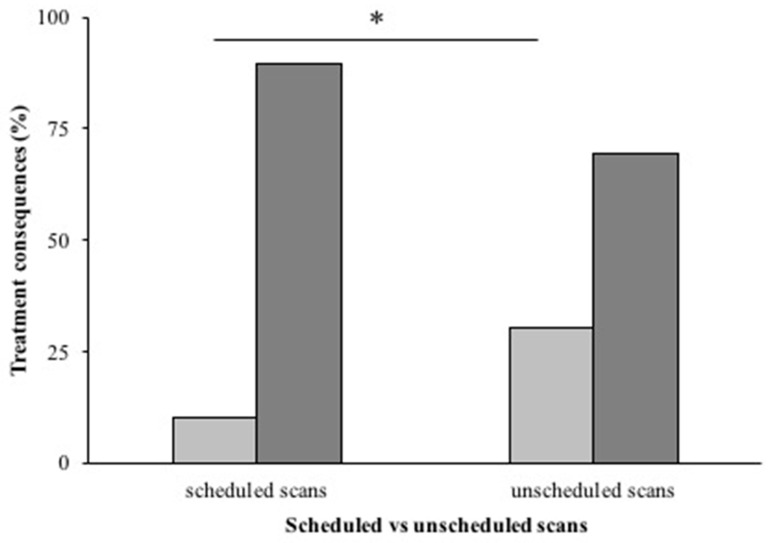
Figure 2.
Treatment consequences for scheduled and unscheduled scans. Percentage of major treatment consequences (in light gray bars) compared to no or minor treatment consequences (dark gray bars) for both scheduled follow-up scans (left) and unscheduled scans (right). Unscheduled scans resulted in significantly more major treatment consequences than scheduled scans (* = p < 0.001).

