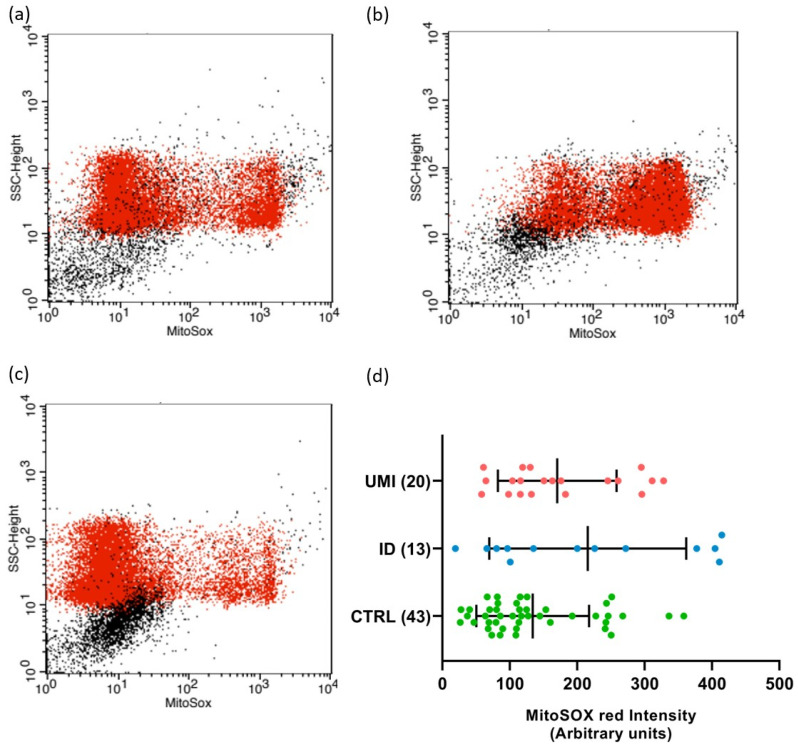
Figure 4.
Sperm mitochondrial superoxide levels. Flow cytometry dot-plot chart of CTRL (a), ID (b), and (c) UMI sperm cells labelled with MitoSOX (red dots). (d) MitoSOX fluorescence intensity (arbitrary units) on the three study groups. Data are presented as mean ± SEM and the number of experiments is indicated in brackets. CTRL—healthy men, ID—idiopathic infertile men, UMI—unexplained infertile men.

