Figure 3.
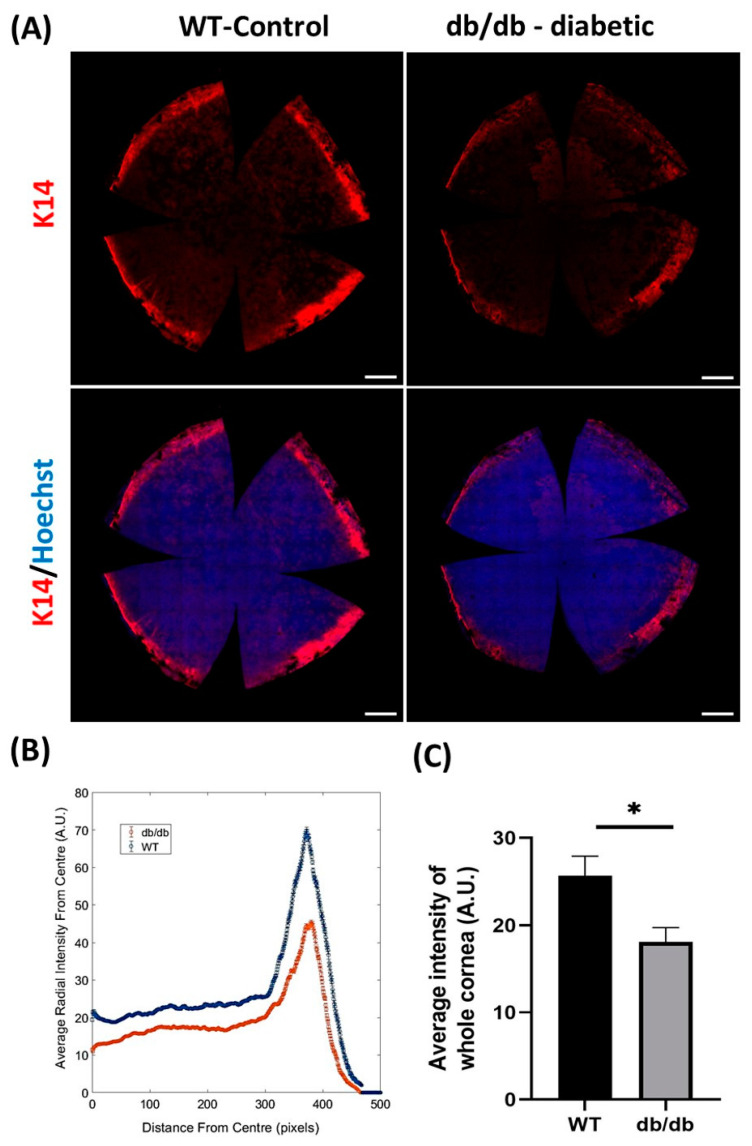
Measurement of K14 immunofluorescence staining intensity in db/db and WT control murine corneas. Intensity for K14 was measured in whole corneas obtained from 32-week-old db/db (n = 6) and WT (n = 6) mice after imaging with a scanning confocal microscope with 20 objective lens. (A) Representative images of K14 immunofluorescence staining (red) in whole-mount WT and db/db mouse corneas. Hoechst (blue) was used to visualize cell nuclei. (B) Comparison of average K14 staining intensity profile relative to distance (in pixels) from center of each whole cornea. Individual values represent average radial intensity at a specific distance (in pixels) from the center. Peak profile on graph represents intensity of K14 signal in the limbal region of db/db (red) and WT (blue) corneas. (C) Computed average K14 intensity in corneas is significantly decreased in db/db compared to WT corneas. All images represent the maximum intensity projection of epithelial layers. Statistical significance was determined using an unpaired Student’s t-test (* p < 0.05). Error bars represent ± standard error of mean. Scale bars represent 500 µm. All immunofluorescence procedures, microscopy and image acquisition were standardized and performed according to our previous reports [30,66].

