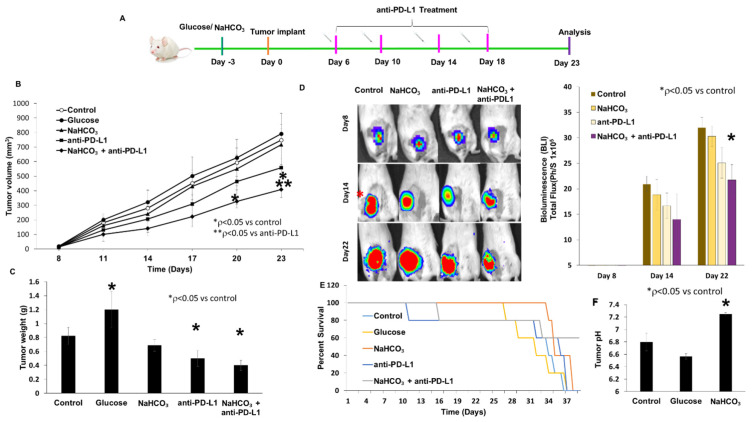
Figure 3.
Effect of combined anti-PD-L1 plus NaHCO3 therapy on tumor growth, intratumor pH and survival of mice. (A) Experimental timeline of 4T1-Luc tumor inoculation and anti-PD-L1 antibody treatment. (B) Tumor volumes were measured every 3 days and at the endpoint (* p < 0.05 for NaHCO3 + anti-PD-L1 vs. control; ** p < 0.05 for NaHCO3 + anti-PD-L1 vs. anti-PD-L1). (C) Resected tumor weights at the endpoint (* p < 0.05 for glucose, NaHCO3 + anti-PD-L1 vs. control). (D) Primary tumor growth monitored weekly using BLI. Total flux of the tumor region was quantified at each corresponding time point (photon/sec/cm2) (* p < 0.05 for NaHCO3 + anti-PD-L1 vs. control). (E) Survival curve of mice with treatments and followed until moribund. (F) Intratumor pH measured by microelectrode in response to NaHCO3 or glucose treatment (* p < 0.05 for NaHCO3 vs. control).

