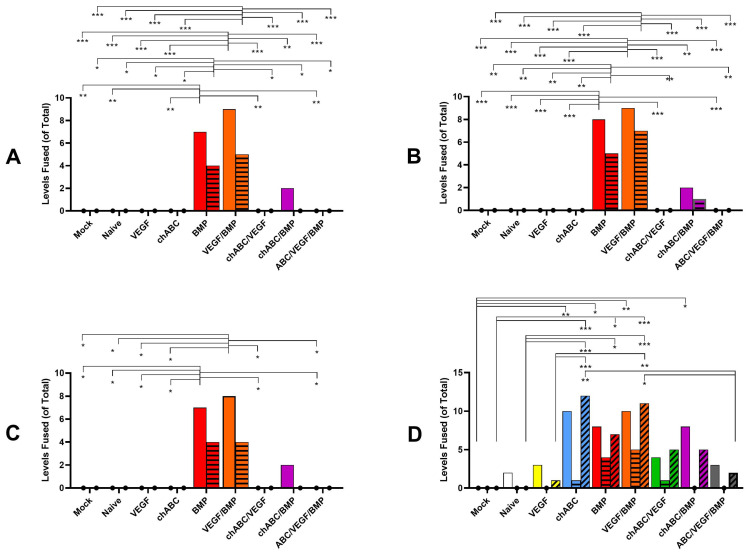
Figure 3.
Multimodal spinal fusion assessments at 12 weeks post-implantation of the indicated treatments. Fusion status was scored separately at the L4/5 (histograms with no lines) and L5/6 (histograms with horizontal lines) levels for all assessments, and for the combined L4–6 (histograms with diagonal lines) segment for the NIAD fusion prediction method. Fusion was assessed by palpation (A), categorical radiographic (B), graded radiographic (C), and critical NIAD values (D), as described in the Materials and Methods section. Histogram vertical heights indicate raw value for number of fusions, and group size was n = 15 for all treatments except chondroitinase ABC (chABC)/VEGF (n = 16). Indicated significance was p ≤ 0.001 (***), p < 0.01 (**), and p ≤ 0.05 (*).

