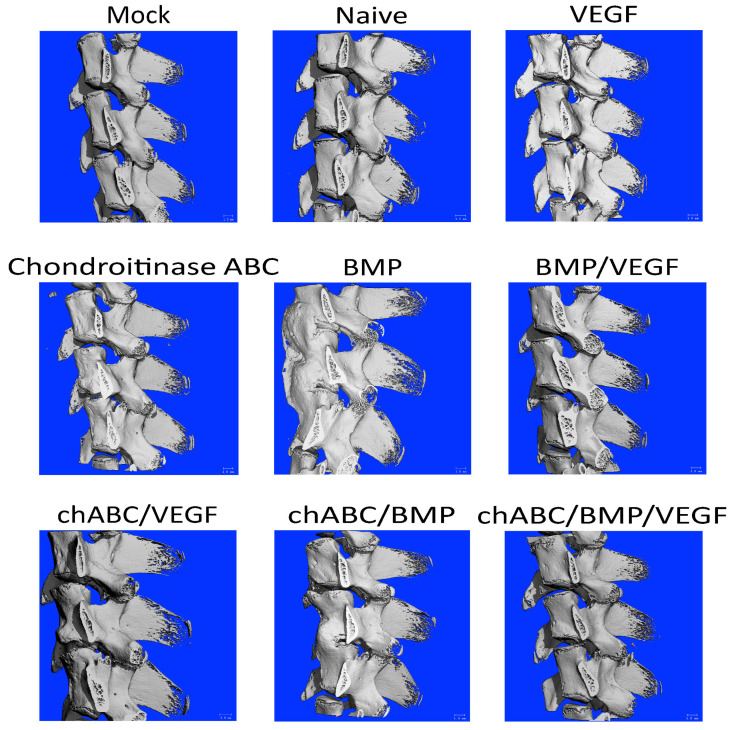
Figure A8.
Selected micro-CT 3-dimensional isosurface renderings demonstrating bone induction. All samples are oriented caudal at the top, cranial at the bottom, ventral to left and dorsal to right, with vertebral L6-L4 represented top to bottom, and the scale marking in the lower right corner representing 1mm. Micro-CT assessment was performed at 12 weeks after treatment delivery. Chondroitinase ABC is abbreviated as chABC. Note induced bone causing fusion for both levels of the BMP-treated sample and for the L4/5 level of the chABC/BMP treated sample. Also note that despite the BMP/VEGF treatment group showing excellent bone production overall, the sample shown here did not produce bone at either level implanted.

