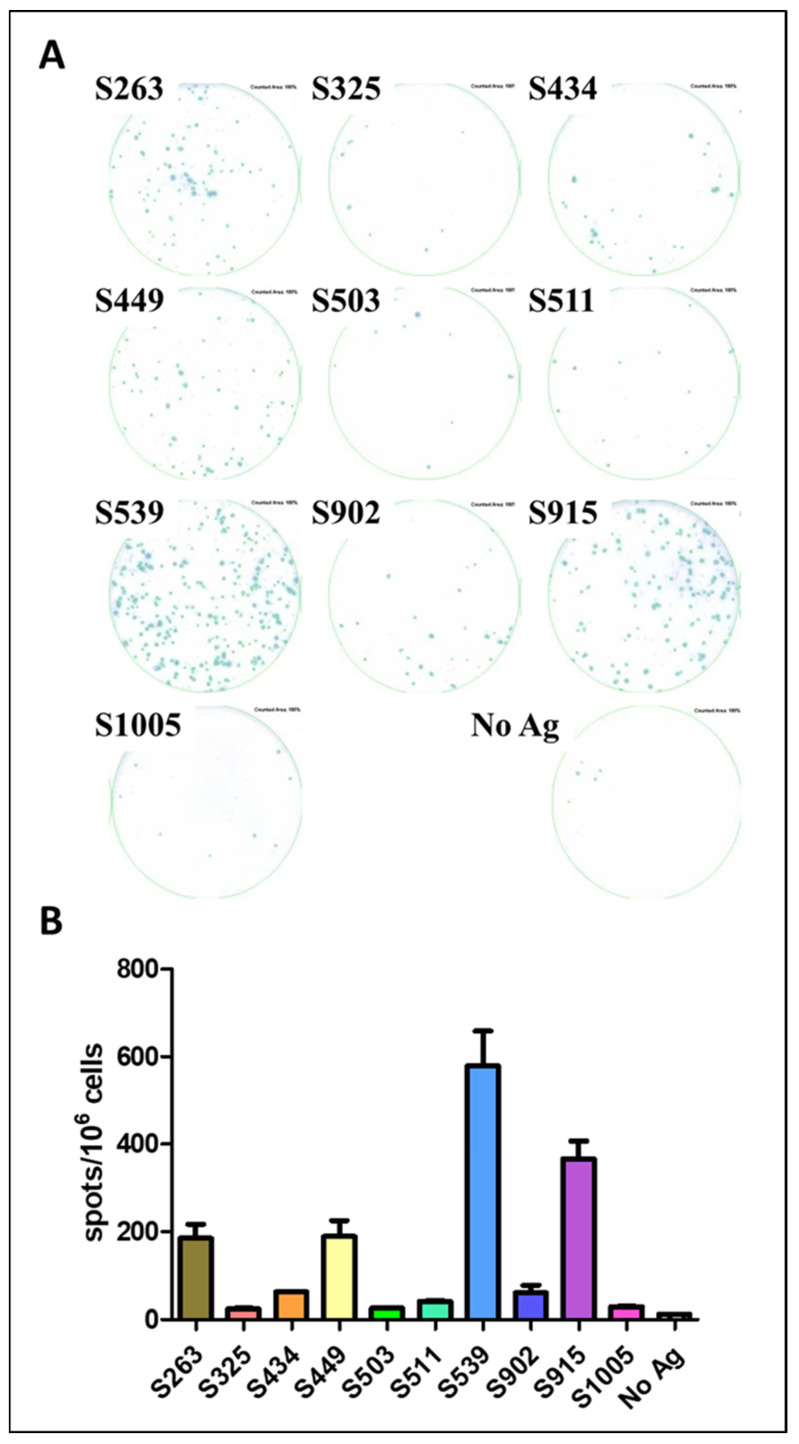
Figure 4.
Evaluation of Spike epitopes from in-silico screen following SARS-CoV-2 infection. C57BL/6 mice were infected i.n. with 104 pfu MA10 SARS-CoV-2 and sacrificed after 21 days. T-cell response to different Spike epitopes was evaluated on a pool of splenocytes from infected animals (n = 5) by ELISpot assay (A) and quantified (B). Bars indicate means ± SEM of 3 replicates. Values were normalized to spots per 106 seeded cells.

