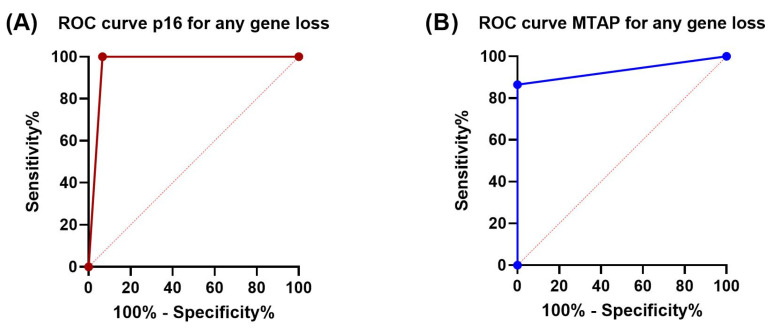
Figure 4.
ROC curves showing diagnostic sensitivity and specificity of p16 and MTAP IHC for homozygous and heterozygous loss of CDKN2A and MTAP genes: (A) P16 sensitivity 100%, specificity 93%, AUC 0.97 (95% CI: 0.89–1.0); (B) MTAP sensitivity 86.5%, specificity 100%, AUC 0.93 (95% CI: 0.86–1.0). AUC is annotaed with 95% CI using the Wilson/Brown method.

