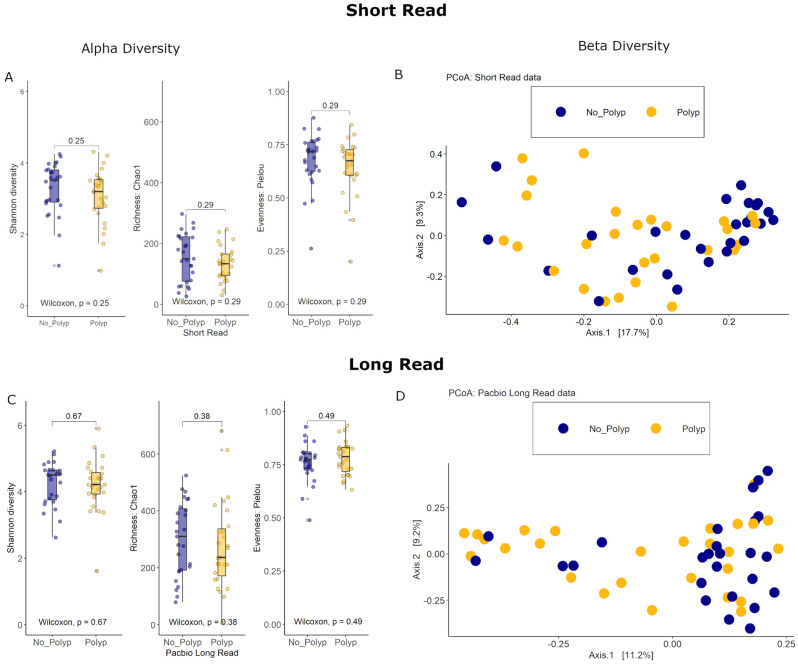
Figure 4.
Short-read data: (A) Alpha diversity: Box plots of the Shannon diversity index, Chao1 richness estimator, and Pielou evenness index (B) Beta diversity: PCoA of the Bray–Curtis distance measure. PacBio long-read data: (C) Alpha diversity: Box plots of the Shannon diversity index, Chao1 richness estimator, and Pielou evenness index. (D) Beta diversity: PCoA of the Bray–Curtis distance measure. All data colored by polyp status.

