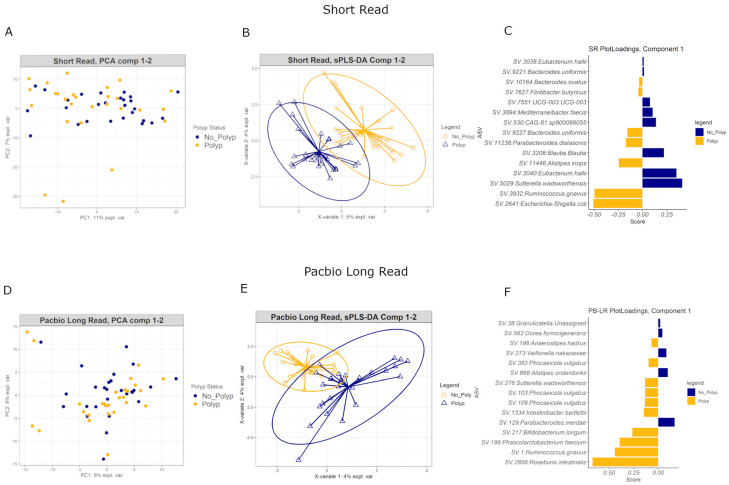
Figure 8.
Principal Components Analysis for (A) short-read and (D) PacBio long-read data. Sparse Partial Least Squares Discriminant Analysis for (B) short-read and (E) PacBio long-read data. Each plot is colored by polyp status. Bar plots for (C) short-read and (F) PacBio long-read data: ASVs are ranked according to how influential they are in contributing to the variability in component 1 with the most important on the bottom. The color of each bar corresponds to which group (polyp or polyp-free) has the higher median for the ASV.

