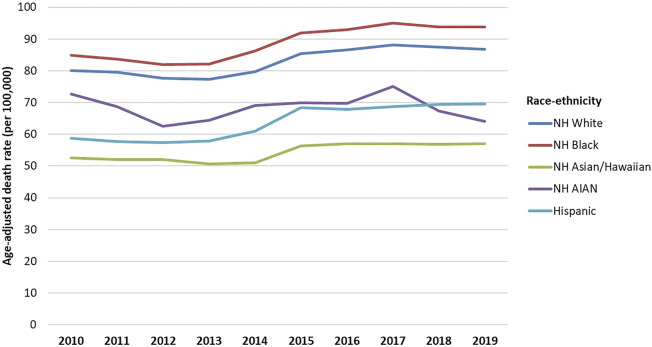
Figure 1. Age-Adjusted Mortality for Neurologic Diseases by Race/Ethnicity, United States, 2010–2019.
Notes: Race/ethnicity was categorized as Hispanic and NH Asian (including Asian, Native Hawaiian, and other Pacific Islander), American Indian and Alaska Native (AIAN), Black, and White populations. Mortality rates are for neurologic diseases (not including diseases with Potential Neurologic Manifestations), as defined in eAppendix 1 (links.lww.com/WNL/C925). NH = non-Hispanic.

