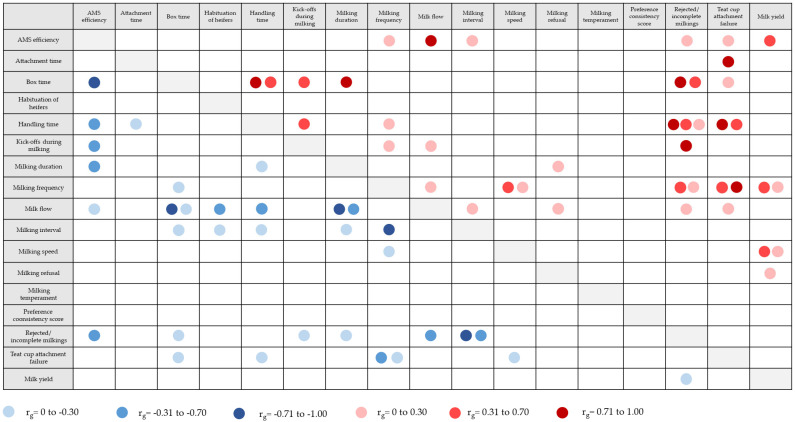
Figure 3.
Genetic correlations among behaviour traits from Table 2 and between behaviour traits and milk yield. The correlations are based on references listed in Table 2. Circles indicate the range of genetic correlations. Positive genetic correlations are presented above the diagonal and negative genetic correlations are presented below the diagonal.

