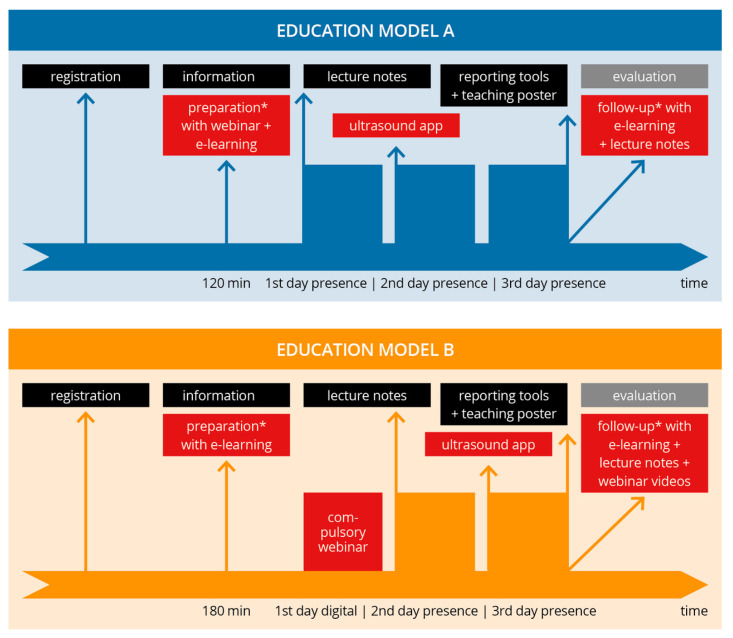
Figure 1.
Study process and overview of the educational models. Flowchart providing the schedule of both course models (A: traditional; B: blended learning). The digital elements of both models are shown in red. In both models, the same evaluation (gray box) was performed, representing the endpoints of the study. * voluntary part of the course.

