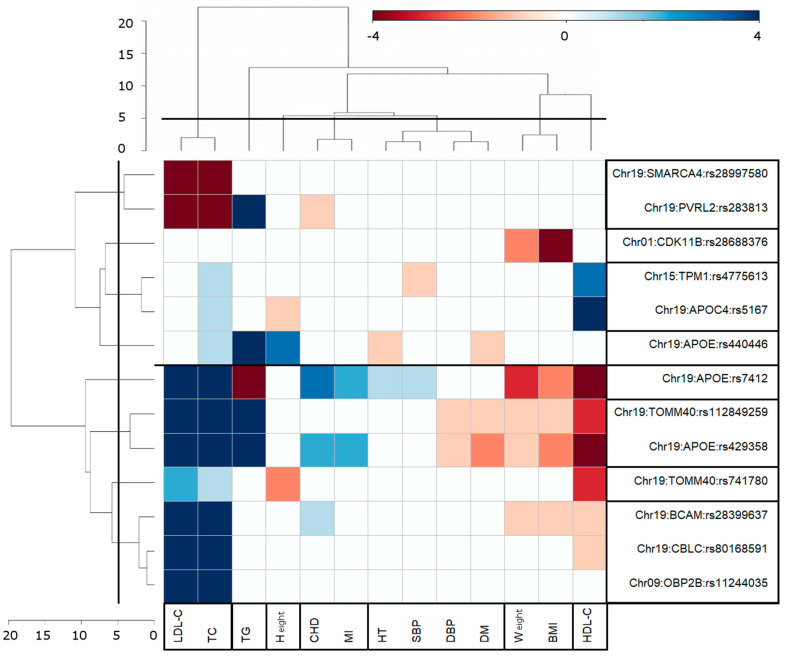
Figure 2.
Eight clusters of SNPs and seven clusters of phenotypes based on significant pleiotropic pair-wise associations with AD and each of the other 13 age-related traits. Blue (red) color and its shades shows SNP–phenotype associations with the same (opposite) effect direction compared to the respective SNP–AD associations. Alleles, which demonstrated detrimental association with AD (positive betas), were considered effect alleles. Boxes show SNP and phenotypic clusters of pleiotropic associations, which were selected at a score (height) level of 5, as represented by axes with numbers on the horizontal (phenotypes) and vertical (SNPs) dendrograms. The x-axis shows the phenotypes, while y-axis refers to the SNPs and their respective genes. The horizontal solid line in the center shows the separation of the SNP clusters into two groups based on their significance and the effect directions of their associations with the first phenotypic cluster (LDL-C, TC). Hierarchical cluster algorithm with Euclidian measure and Ward’s method as implemented in R function hclust was used for this plot.

