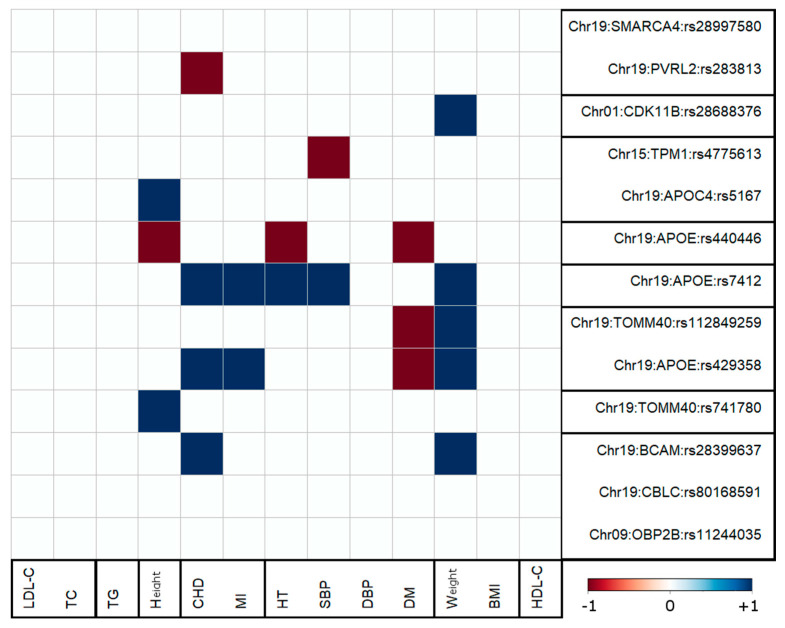
Figure 3.
Antagonistic genetic heterogeneity of significant pleiotropic pair-wise associations with AD and each of the other 13 age-related traits. Blue (red) color shows non-antagonistic (antagonistic) genetic heterogeneity. The results are presented for phenotypes that exhibit significant correlations with AD. Therefore, associations involving lipids, BMI, and DBP were excluded from this figure (see Table 2). Refer to Figure 2 caption for other notations.

