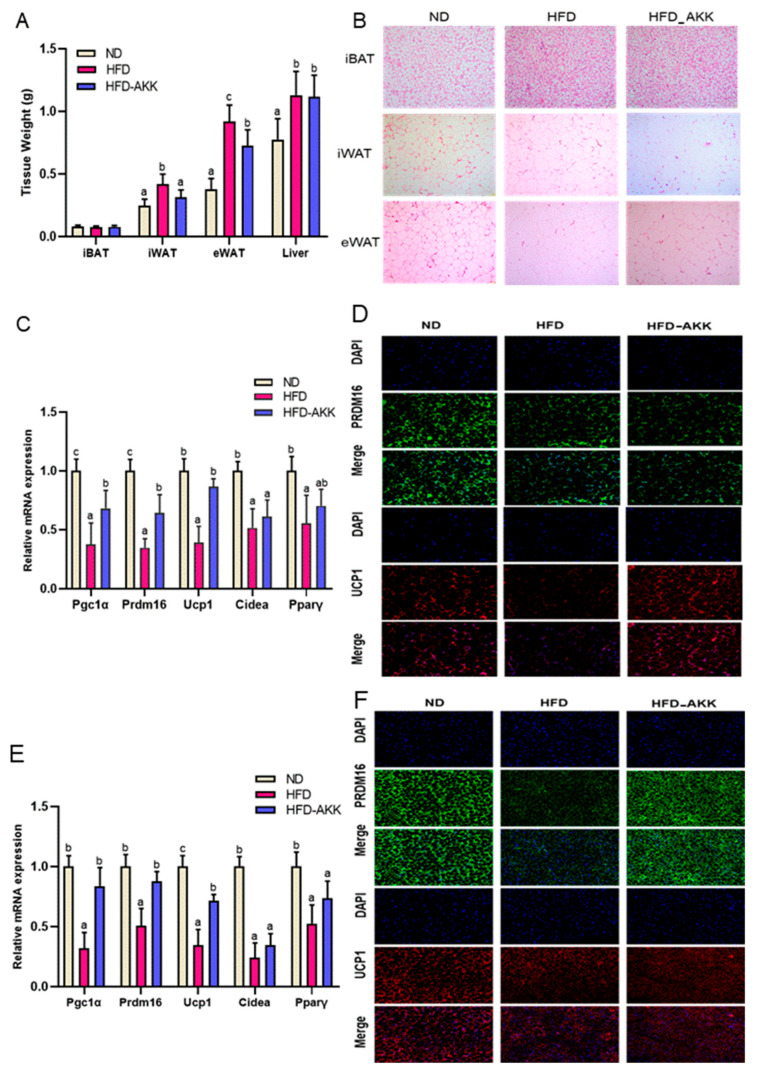
Figure 8.
The weight of iBAT, rWAT, eWAT, iWAT, and the liver (A). H&E staining of iWAT, iBAT, and eWAT (B). Thermogenic and mitochondrial gene expression in iWAT (C). PRDM16 and UCP1 immunofluorescent staining in iWAT (D). Thermogenic and mitochondrial gene expression in iBAT (E). PRDM16 and UCP1 immunofluorescent staining in iBAT (F). Adipocyte histology was observed at a magnification of 20×. Different letters are used to denote significance (p < 0.05) among groups.

