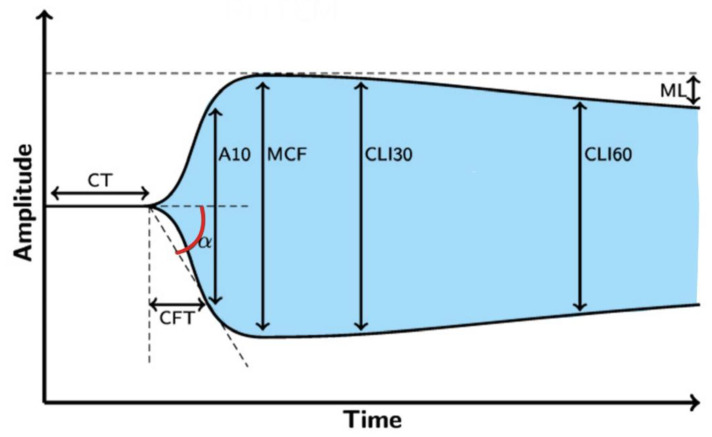
Figure 1.
The resulting curve of rotational thromboelastometry. Legend: CT—clotting time (s), CFT—clot formation time (s), α—angle of clot polymerization rate (°), A10—clot strength value in time of 10 min from CT (mm), MCF—maximum clot firmness (mm), CLI30—lysis index 30 min after clotting time (%), CLI60—lysis index 60 min after clotting time (%), ML—maximum clot lysis (%).

