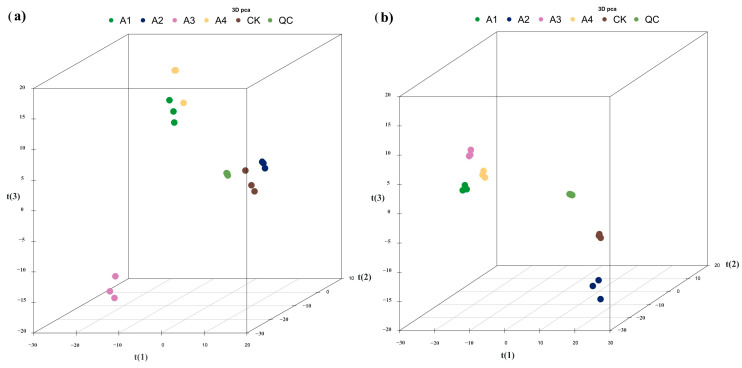
Figure 8.
PCA score plot of samples under positive and negative ion separation. Note: (a) PCA score plot under positive ion separation, (b) PCA score plot under negative ion separation. t(1) represents principal component 1, t(2) represents principal component 2, t(3) represents principal component 3, and the aggregation degree of QC samples reflects the repeatability of the experiment.

