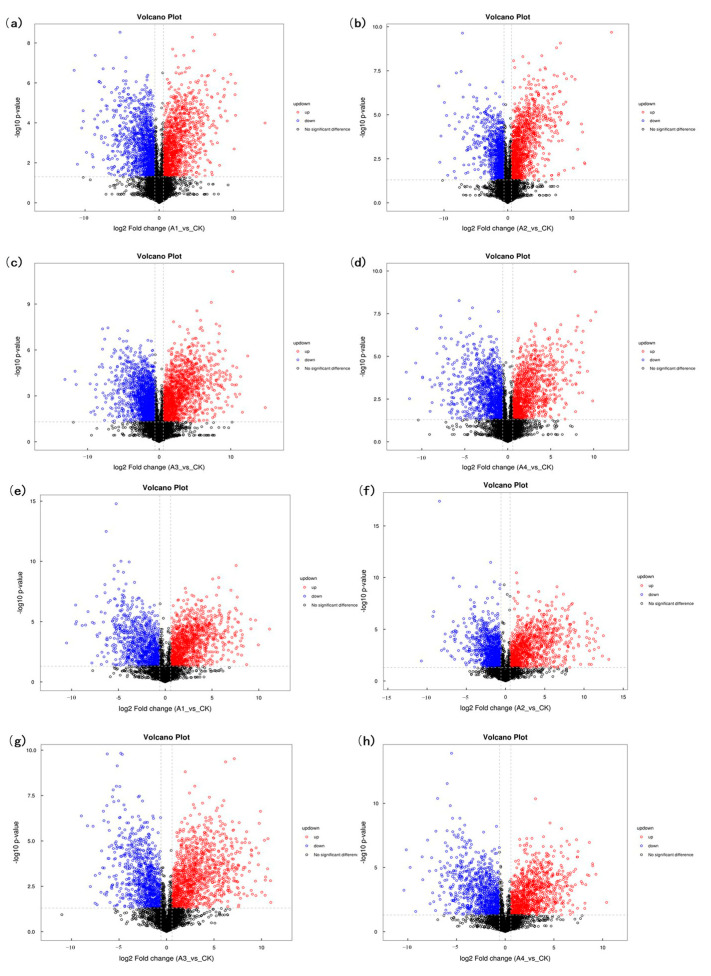
Figure 10.
Differential protein volcano map. Note: (a–d) shows the volcano map of differentially expressed proteins between the A1–A4 group and the control group at positive ion mode. (e–h) shows the volcano plots of differentially expressed proteins between A1–A4 group and control group at negative ion mode. Red represents the up-regulated metabolite content, blue represents the down-regulated metabolite content, and black represents no difference in metabolite content.

