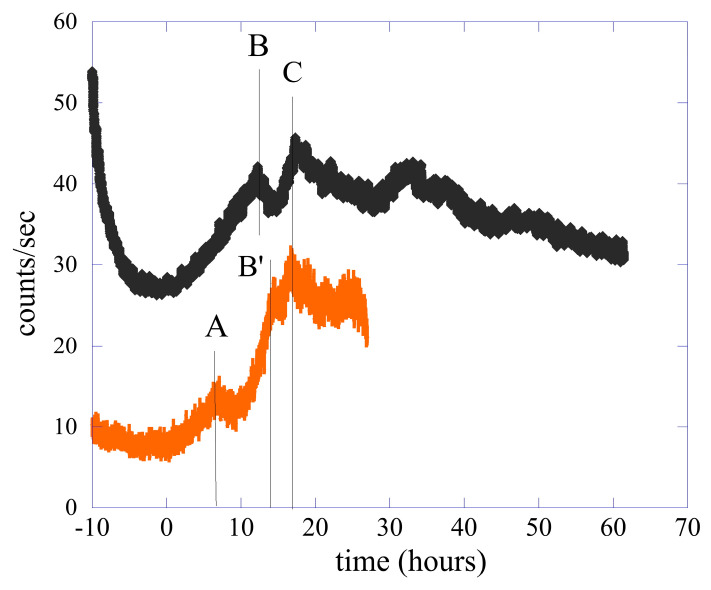
Figure 2.
Comparison between the biophoton emission of the single bean with the emission of the 76 seeds of lentil. For clarity, the curve relating to the emission of lentils has been moved upwards, and it has been used in the time scale of the lentil’s emission. To obtain the time scale of the single bean, multiply the numbers by the factor 6.1 and add 100 h. The capital letters in the figure indicate the main emission peaks observed in the experimental data and are used in the discussion in the manuscript.

