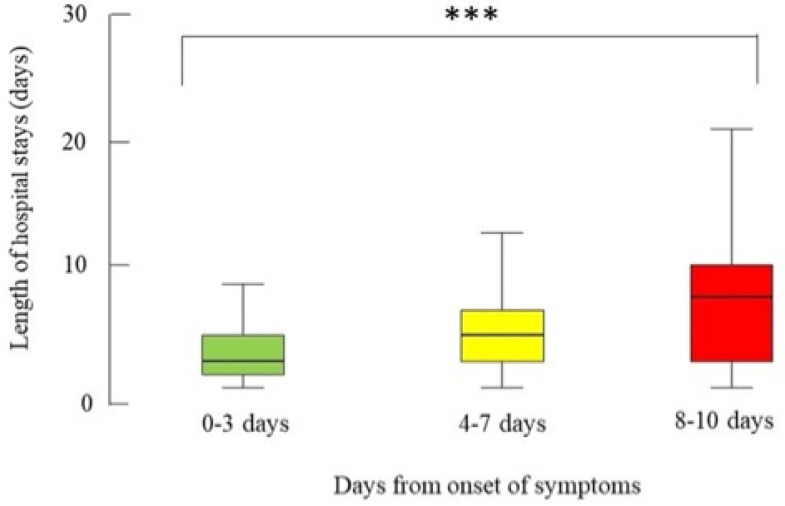
Figure 2.
Box-and-whisker plot of the length of hospital stay (days) of the patients who were operated on for acute cholecystitis from September 2021 to September 2022 from 79 centres in 19 countries by the time between the onset of symptoms and surgery, n = 117. The box represents the 25th to the 75th percentile IQR. The horizontal line within each box represents the median. *** p < 0.001, Kruskal-Wallis test.

