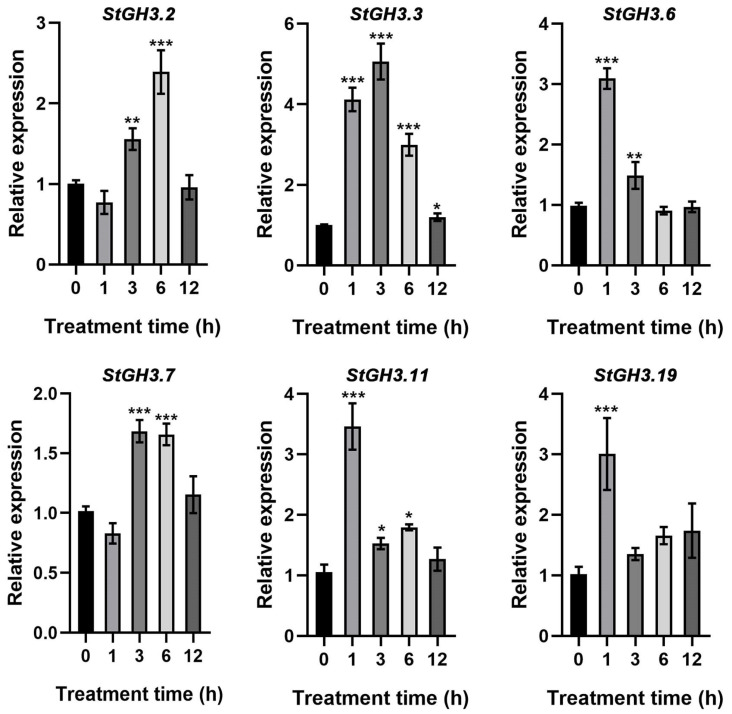
Figure 7.
The relative expression level of StGH3 genes under 200 mM mannitol stress treatments. The 0 h timepoint was taken as a reference to determine relative mRNA levels under stress conditions. Data represent the mean ± SD of three replicates. Data points marked with an asterisk (* p ≤ 0.05, ** p ≤ 0.01, and *** p ≤ 0.001) indicate statistically significant differences between control and stress treatments.

