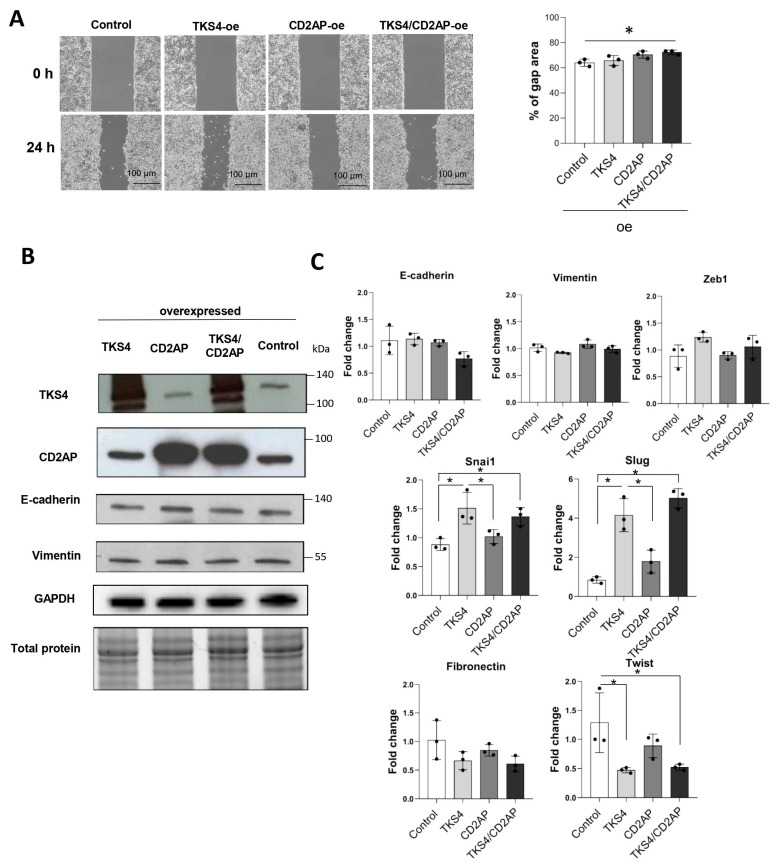
Figure 4.
Overexpression of TKS4 and/or CD2AP in HCT116 colon cancer cells. (A) Wound healing assays with CD2AP-, TKS4-, and CD2AP/TKS4-overexpressing HCT116 cells and the “% of gap area” was calculated 24 h after scratching. Dots indicate the percentage of gap area of three replicates from each group. Between-group comparisons were performed using one-way ANOVA and the Benjamini–Hochberg FDR (false discovery rate) procedure, and statistical significance was set at * p < 0.05. (n = 3). (B) Protein levels of EMT markers (E-cadherin and vimentin) as measured via WB. Dots indicate the values from three independent experiments. (C) qPCR analyses of EMT markers in TKS4 and/or CD2AP- overexpressed (oe) HCT116 cells. Results are shown as fold change relative to the control. Dots indicate the values from three biological replicates. Between-group comparisons were performed using one-way ANOVA and the Benjamini–Hochberg FDR procedure, and statistical significance was set at * p < 0.05. (n = 3).

