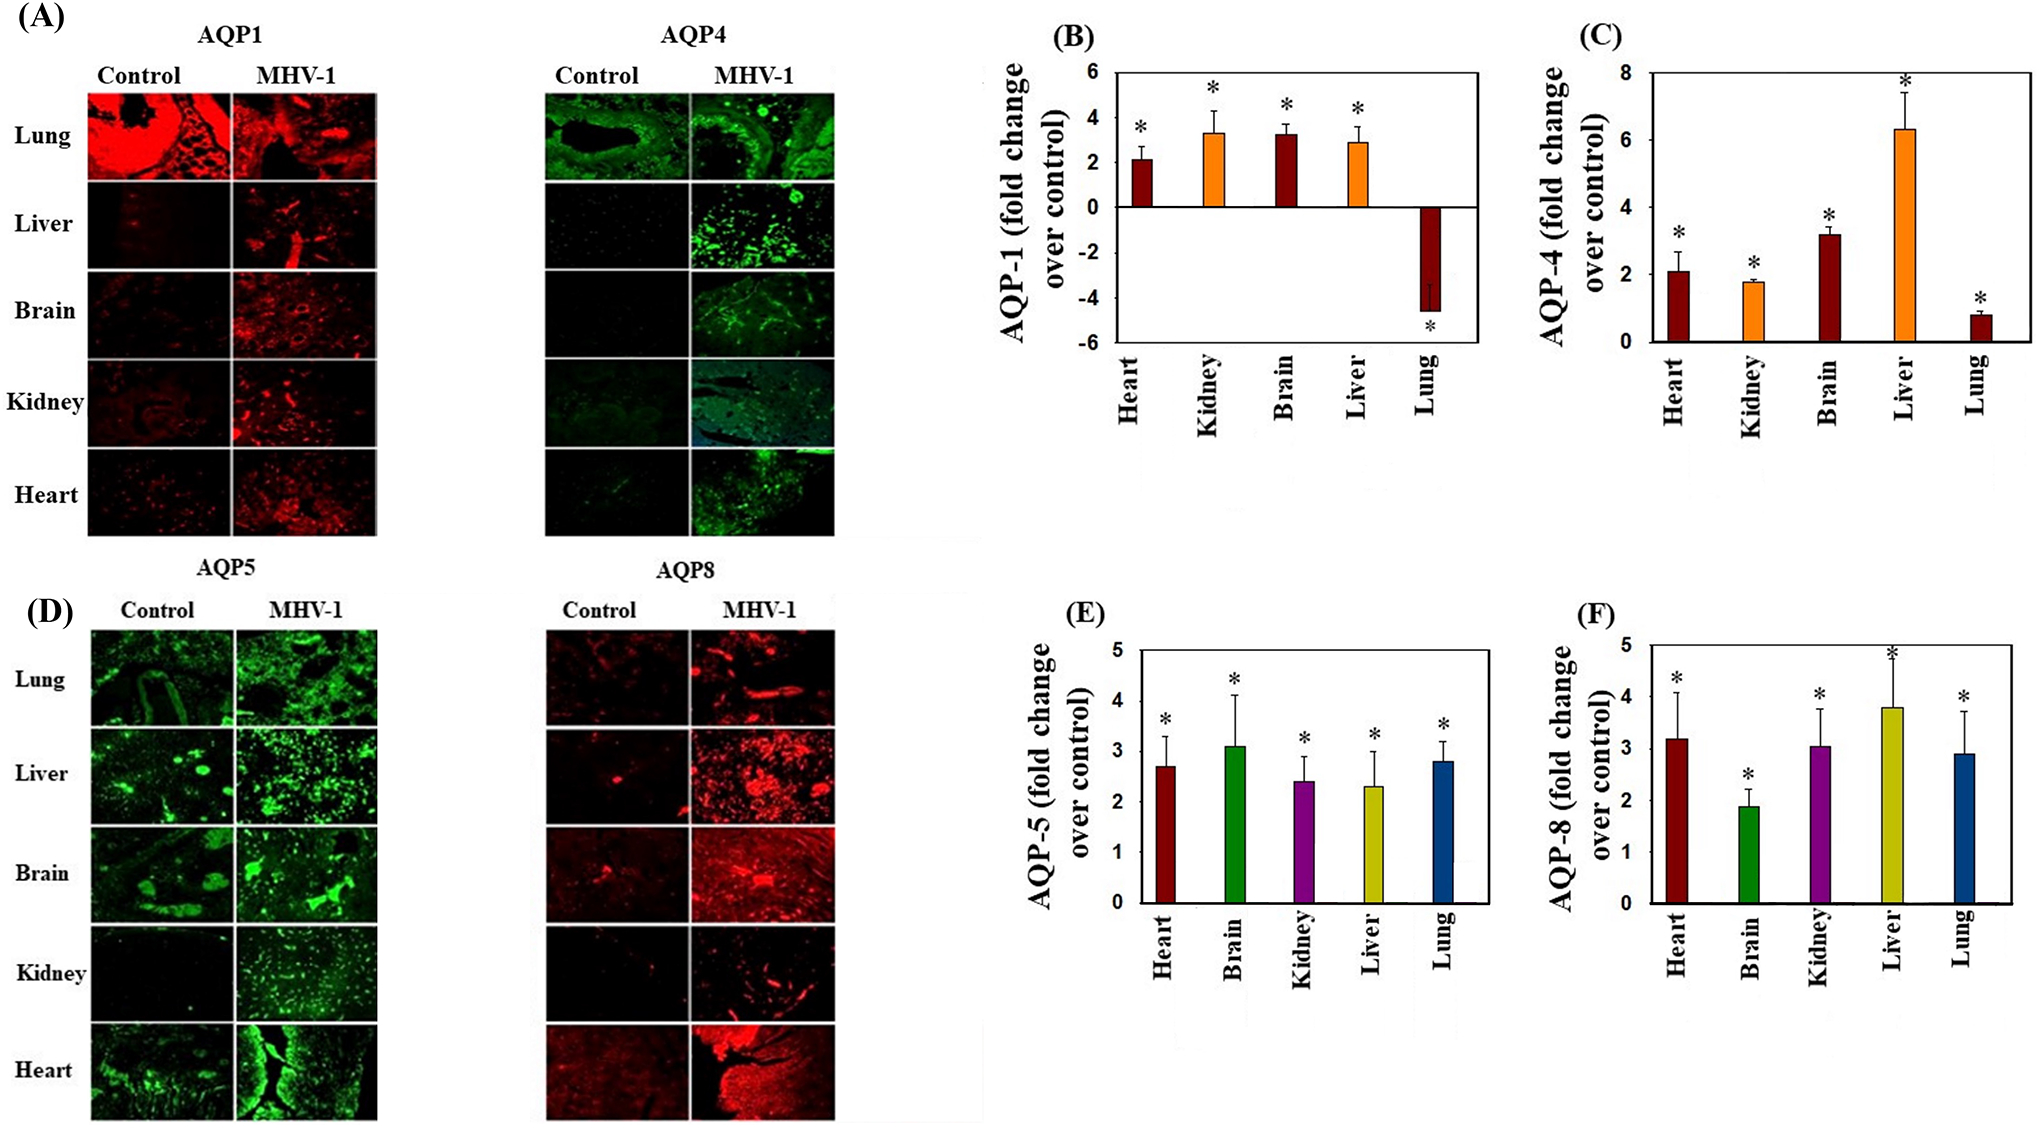
Figure 8.

Altered AQP levels were identified in various organs post-MHV-1 inoculation. Immunofluorescences showed an increase in AQPs 1, 4, 5, and 8 in various organs, while AQP1 levels were decreased in lungs post-MHV-1. Scale bar = 25 μm. Quantitation of AQPs 1, 4, 5, and 8 immunofluorescence images. ANOVA, n=5 (Control) and 16 (MHV-1). *p<0.05 versus control. Error bars represent mean ± SEM.
