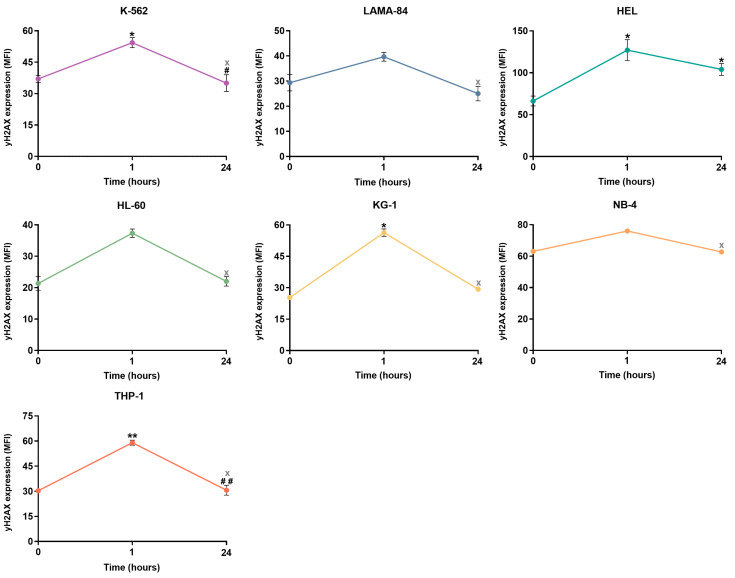
Figure 4.
Double-strand breaks repair kinetics in CML and AML cells following H2O2 exposure. The baseline DNA damage levels of the cell lines correspond to the 0 h time point. The results represent the mean ± SEM of γH2AX mean fluorescence intensity (MFI) obtained from 3 independent experiments. Statistical analyses were performed using one-way ANOVA for repeated measures, followed by Tukey’s multiple comparisons test or Friedman test, followed by Dunn’s multiple comparisons test (KG-1, HL-60, and NB-4). * p < 0.05, and ** p < 0.01 (comparison with the 0 h time point); # p < 0.05, and ## p < 0.01 (comparison with the 1 h time point). The “x” represents the absence of significant differences between 0 h and 24 h.

