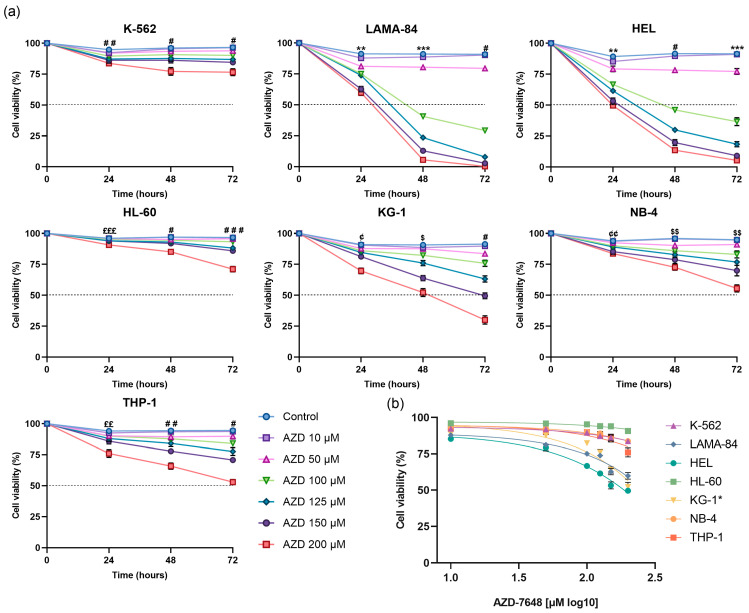
Figure 5.
The effect of AZD-7648 (AZD) on cell viability in CML and AML cell lines. (a) Results are expressed as cellular viability, represented as a percentage (%) of viable cells. Results represent the mean ± SEM of 5 independent experiments. Data were statistically analyzed at each time point by comparison of the tested doses with the control using ordinary one-way ANOVA followed by Dunnett’s multiple comparisons test or Kruskal–Wallis test followed by Dunn’s multiple comparisons test. (b) Log dose–response viability curve of AZD-7648 after 24 or 48 (KG-1*) hours of treatment. Results represent the mean ± SEM of 5 independent experiments. ** p < 0.01, and *** p < 0.001 (control vs. 50, 100, 125, 150, and 200 μM); $ p < 0.05, and $$ p < 0.01 (control vs. 100, 125, 150, and 200 μM); # p < 0.05, ## p < 0.01, and ### p < 0.001 (control vs. 125, 150 and 200 μM); ¢ p < 0.05, and ¢¢ p < 0.01 (control vs. 150, and 200 μM); ££ p < 0.01, and £££ p < 0.001 (control vs. 200 μM).

