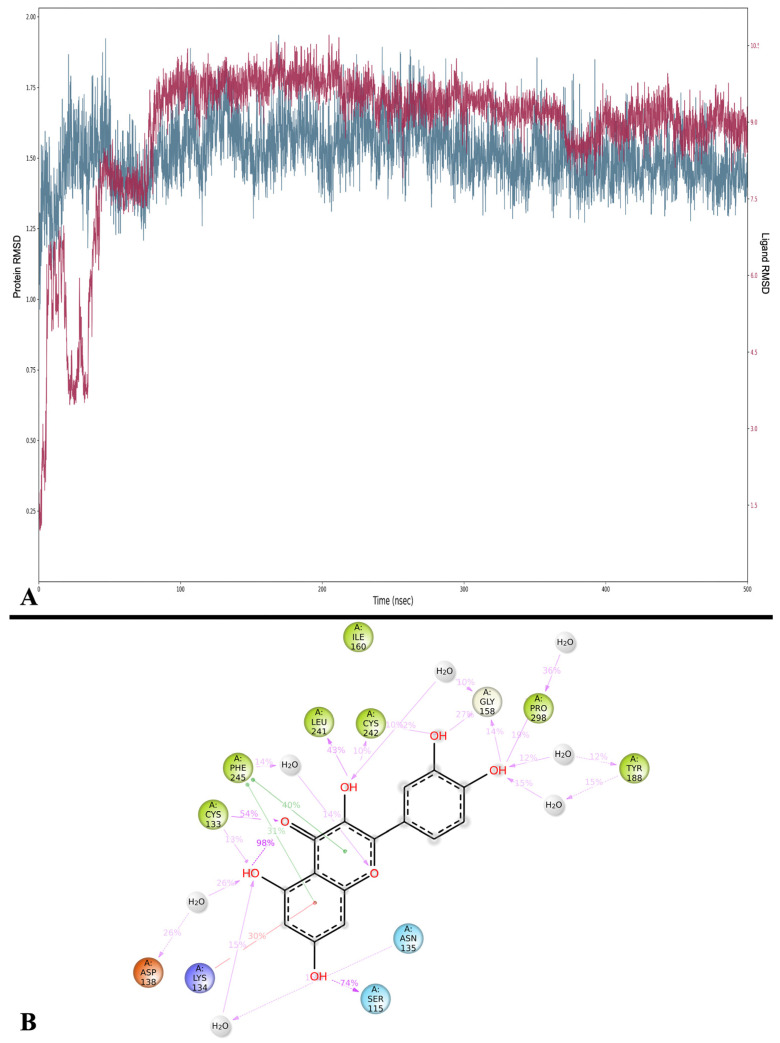
Figure 7.
(A) RMSD analysis of Que (Lig fit on Prot, red) and NOX (Cα, blue). On the x-axis, the simulation time is represented in ns, while on the y-axis, the protein RMSD (left) and ligand RMSD (right) are plotted. (B) Detailed interactions between Que and NOX. Interactions happening for more than 10% of the simulation time are shown. Purple arrows represent H-bonds, while green lines represent π-π stackings.

