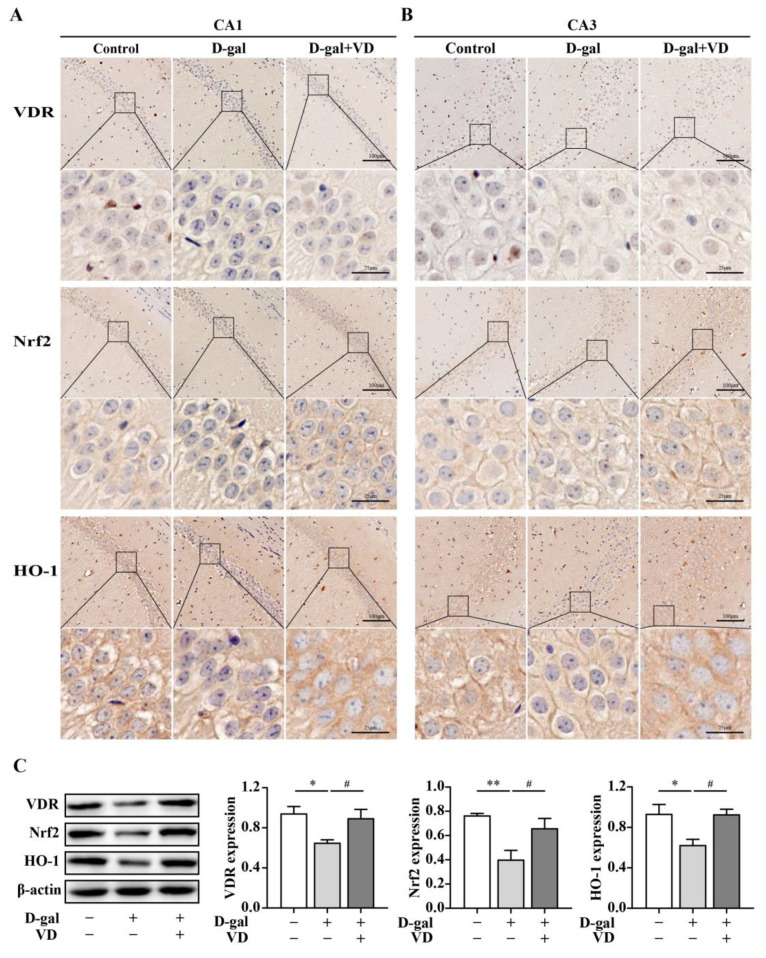
Figure 4.
VDR/Nrf2/HO-1 expression in hippocampus. (A,B) Immunohistochemistry was used to detect the expression of the VDR, Nrf2, and HO-1 in the hippocampus in the CA1 and CA3 regions (bar = 25μm, 100 μm). (C) Protein expression of the VDR (n = 6), Nrf2, and HO-1 (n = 4) in the hippocampal regions. Image J software was used to quantify the VDR, Nrf2, and HO-1 relative density values relative to β-actin. Compared with the control group, * p < 0.05, ** p < 0.01; compared with the D-gal group, # p < 0.05.

