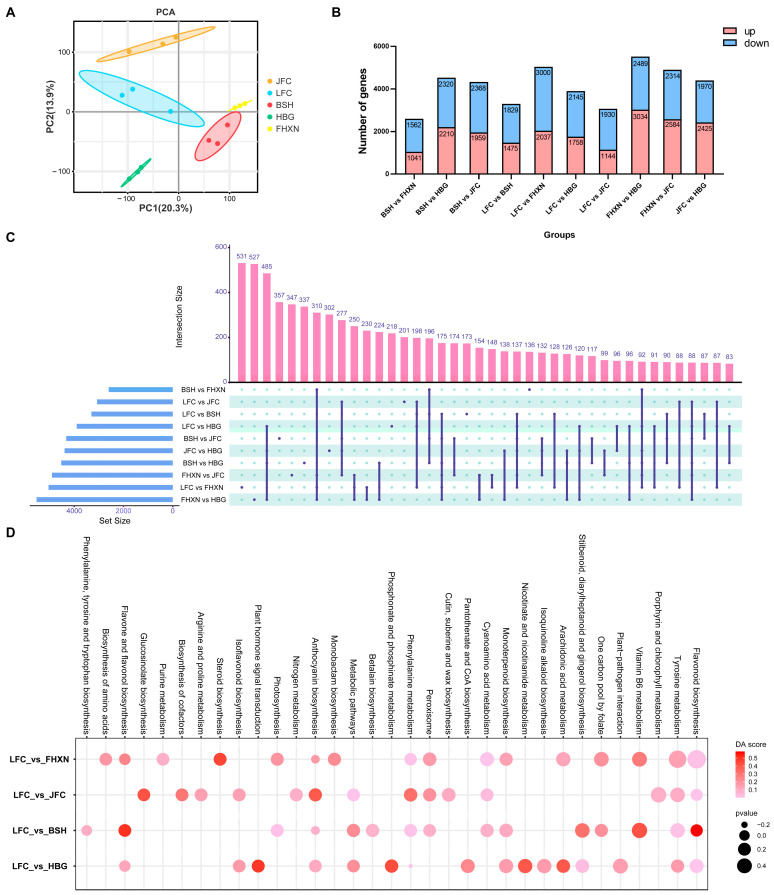
Figure 3.
Transcriptome analysis of leaves among Toona clones. (A) A PCA score plot of the RNA-seq results of various colored Toona. (B) The number of up- and down-regulated genes differs across different comparison groups. (C) A shared number of DEGs across varying comparison groups. (D) A KEGG pathway enrichment bubble plot for DEGs between different comparison groups.

