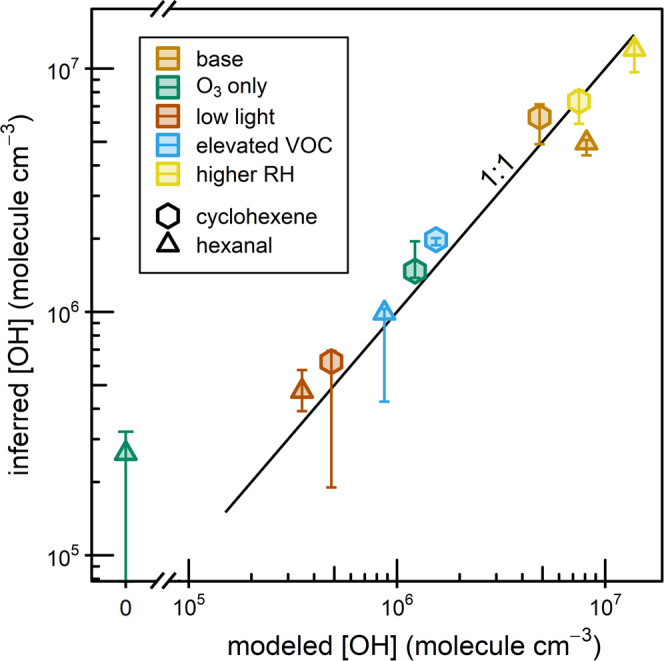
Figure 3.

Experimentally derived average OH concentration vs average OH concentration predicted by the box model for all cyclohexene and hexanal experiments (see Section S3.4). Note the break in the x-axis. Error bars represent the range of values observed throughout the experiment.
