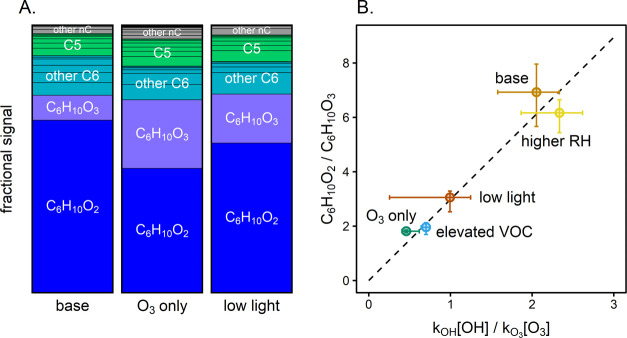
Figure 4.
Gas-phase products from cyclohexene experiments. Panel A: Normalized mass spectrometric signal of products formed in the GUV222 irradiation (base conditions), O3-only, and low-light experiments (see Section S3.5 for calculations and Figure S5 for other experimental conditions). Signals are integrated from t = 250–2500 s, normalized to the total integrated ion signal, and grouped by carbon number (nC). In all cases, products are dominated by C6H10O2 (the major cyclohexene + OH reaction product) and C6H10O3 (the major cyclohexene + O3 product). Panel B: The ratio of the C6H10O2-to-C6H10O3 signals vs the ratio of the rates of OH and O3 oxidation, for all cyclohexene experiments. Concentrations of OH are determined from the fits in Figure 2, while concentrations of O3 are measured directly. The dashed line is a linear fit to the data; since the two products have differing sensitivities in the instrument, this differs from the 1:1 line. Error bars represent the range of values observed throughout the experiment.

