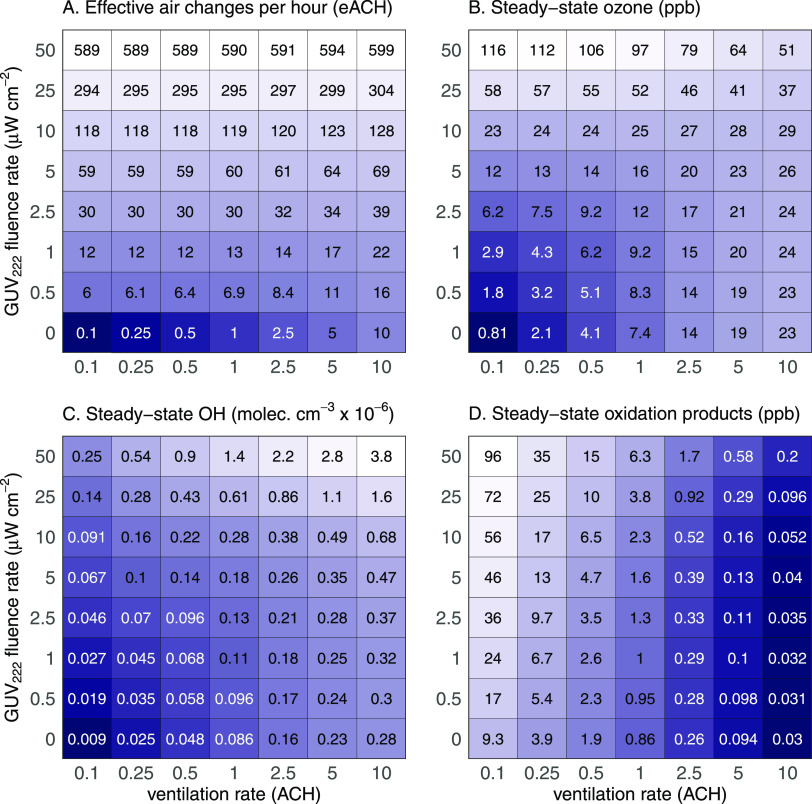
Figure 5.
Effects of ventilation and GUV222 fluence rate on modeled GUV efficacy and indoor air quality (see also Figures S9–S12). Panel A: effective air changes per hour (eACH) for indoor pathogens, based on the previously reported inactivation rate of SARS-CoV-2 at 222 nm45 (Section S4.2). Panels B–D: steady-state concentrations of (B) O3, (C) OH, and (D) organic oxidation products, respectively, as predicted by the photochemical box model. Panel D calculations assume unit yields and do not account for VOC production from surfaces (see Figure S11) or recycling by NOx–HOx interactions (Figure S12), so they likely represent lower limits. Lighter colors represent larger values; note that the logarithmic color scaling is different for each panel. Additional model results are given in Figures S9 and S10.

