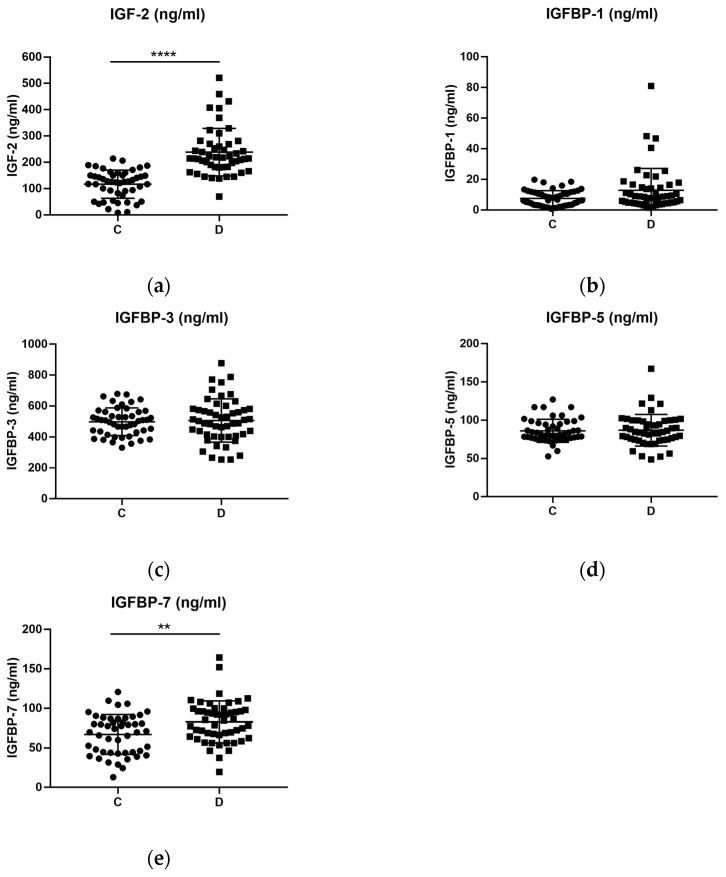
Figure 1.
Plasma levels of IGF (ng/mL) proteins in healthy controls (C) and depressed patients (D). (a) Levels of IGF-2 were significantly increased in the depressed group when compared to the healthy control group with a Mann–Whitney unpaired test. In the cases of (b) IGFBP-1, (c) IGFBP-3 and (d) IGFBP-5, there were no significant differences in plasma levels between the controls and the depressed patients. (e) Levels of IGFBP-7 were also significantly increased in the depressed group after a Student’s t unpaired test. C: Control group. D: Depressed group of patients. ** p-value ≤ 0.01; **** p-value ≤ 0.0001.

