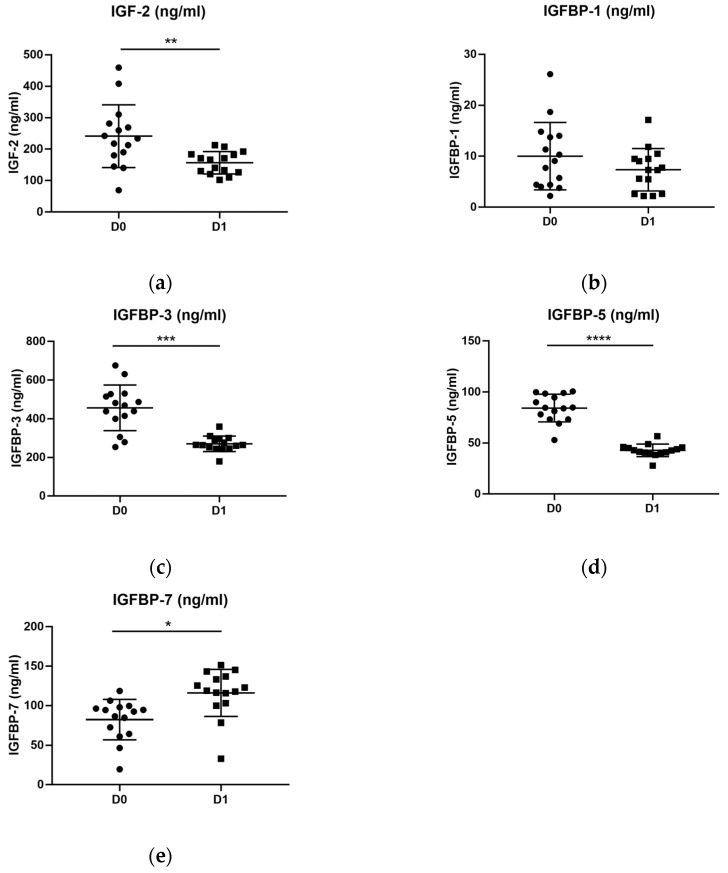
Figure 2.
Plasma levels of IGFs (ng/mL) proteins in patients before (D0) and after (D1) a period of antidepressant treatment. We used a Wilcoxon paired test to compare both distributions. (a) Levels of IGF-2 were significantly decreased after treatment. In the case of (b) IGFBP-1, no statistical difference was detected. (c) IGFBP-3 and (d) IGFBP-5 also showed a significant reduction after treatment. (e) On the contrary, levels of IGFBP-7 were found to be significantly increased after treatment. D0: patients with depression before treatment. D1: patients with depression after treatment. * p-value ≤ 0.05; ** p-value ≤ 0.01; *** p-value ≤ 0.001; **** p-value ≤ 0.0001.

