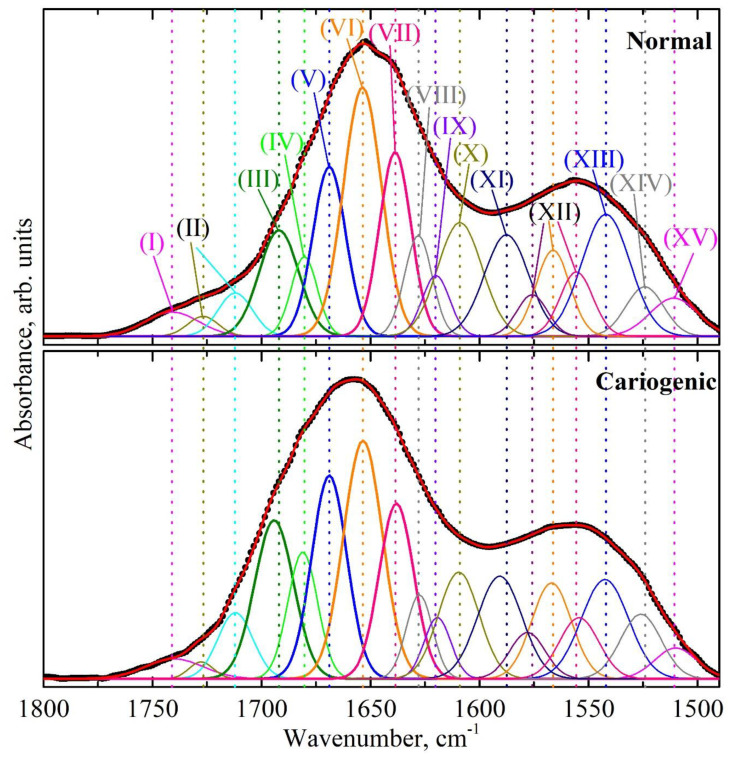
Figure 4.
Results of the deconvolution of the spectral profile in the range of the amide I and amide II bands for typical samples of biofilm from patients with a normal enamel (top) and with carious pathology (bottom) in the second (II) stage of the experiment in the presence of the modulator (tablets with a mineral complex involving calcium glycerophosphate). Absorption bands in the IR range were associated with the following components of proteins’ secondary structure: (I) ν(C=O), acid esters; (II) ν(C=O), lipid esters; (III) anti-parallel β-strands, β-turn; (IV) parallel β-sheet, β-turn; (V) β-turn; (VI) α-helix; (VII) irregular structure, triple helix; (VIII) parallel β-strands; (IX) β-sheet, β-turn; (X) amino acid side chain, intermolecular β-sheet; (XI) δ(NH2), amine; (XII) δ(N–H); (XIII) α-helix, δ(N–H); (XIV) β-sheet, δs(NH+3); (XV) ν(CN), δ(CH), δ(NH).

