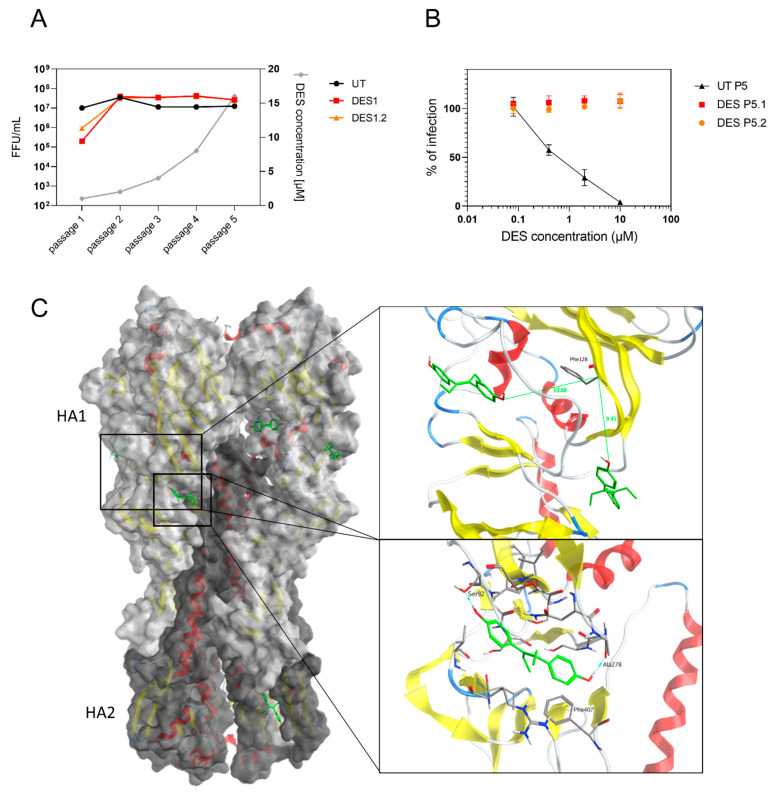
Figure 3.
DES resistance. (A) N09 was passaged in the presence of increasing concentrations of DES. The supernatants were collected when the cells displayed extensive cytopathic effects and titrated. (B) Viruses collected at passage 5 were tested in a dose–response assay for DES inhibition. (C) Hemagglutinin trimer is visualized in complex with DES (green). Zoom on sites close to F128 and on one of the binding sites identified. Red color corresponds to α-helix structures, yellow color toβ-sheets structures.

