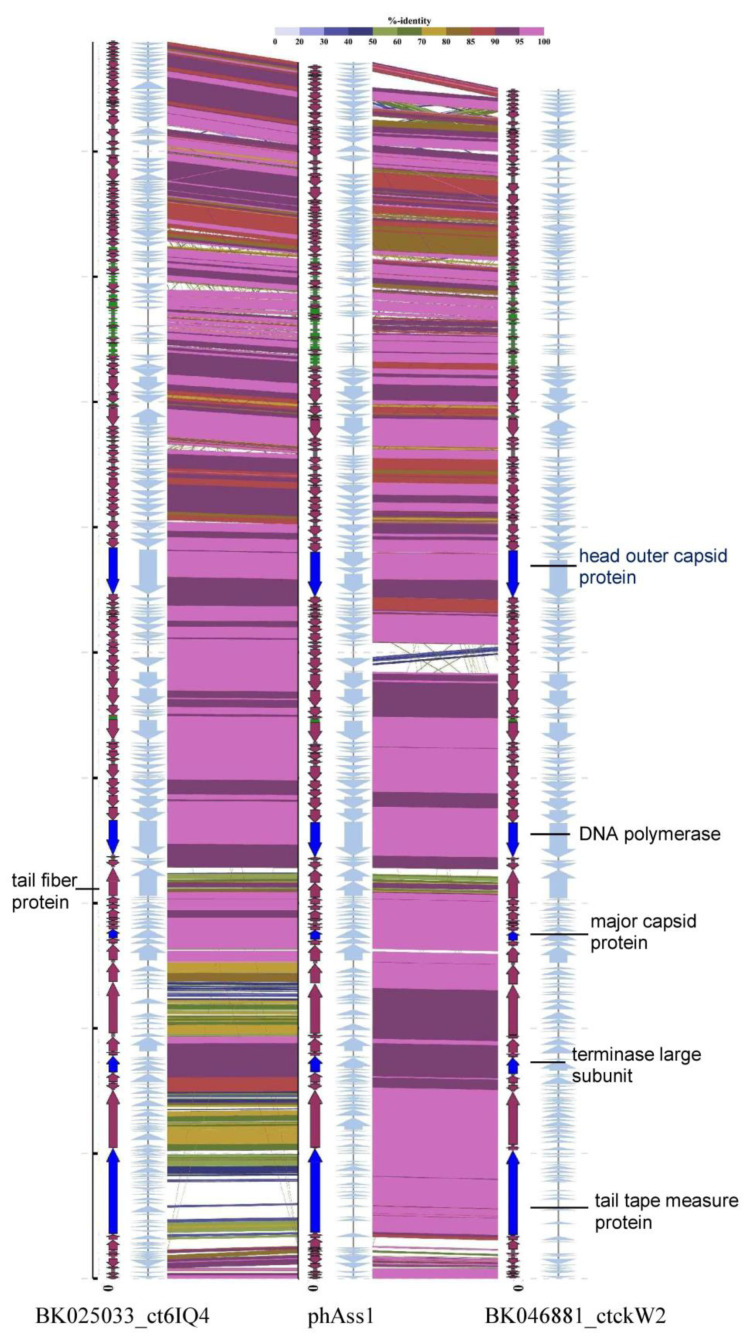
Figure 1.
Comparative alignment of the phAss-1, BK046881_ctckW2, and BK025033_ct6IQ4 genomes. Colored lines between the aligned genomes indicate tBLASTx results. The color scale bar represents the percentage of identity. ORFs are represented by grey arrows (standard code) or colored arrows (TAG -> Gln recoding); the tRNA genes are highlighted in green; the ORFs encoding proteins that were additionally analyzed are colored in bright blue.

