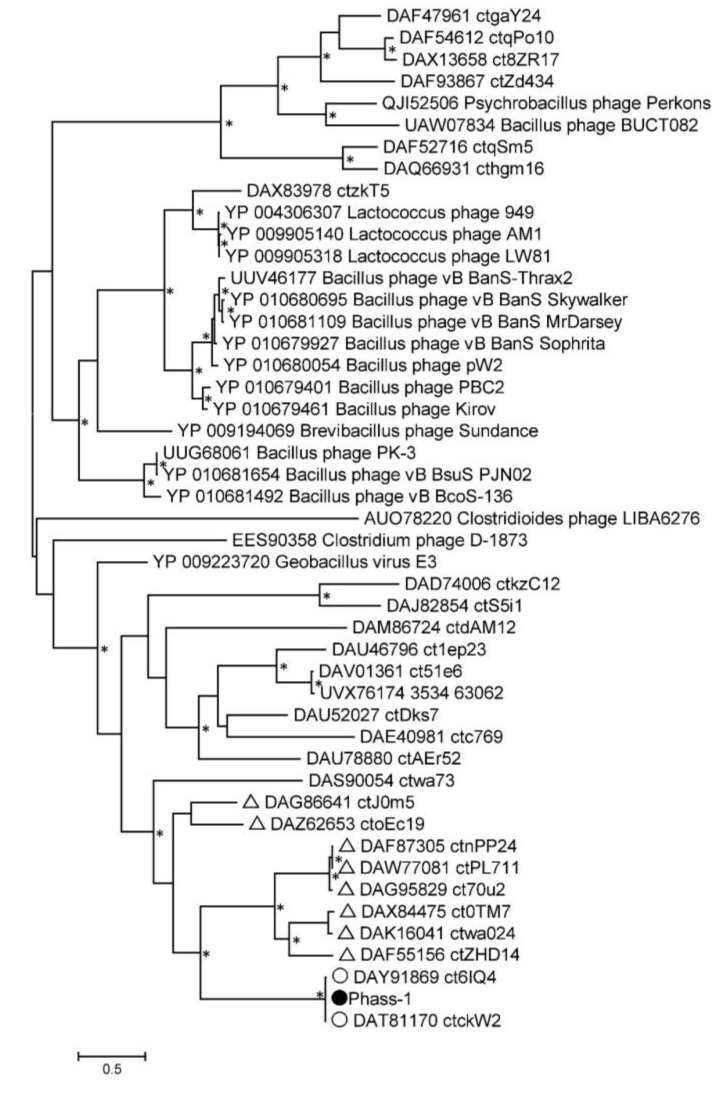
Figure 6.
Maximum Likelihood phylogenetic tree of the phAss-1 terminase large subunit generated using IQ-tree software. The investigated sequence of phAss-1 is marked with a black circle; corresponding sequences of relative phages from the proposed Phassvirus genus are indicated with empty circles; sequences from phage genomes that are listed in Table are marked with empty triangles. Nodes with 95% statistical significance are marked with asterisks calculated from 1000 ultrafast bootstrap (UFBOOT) replicates. The scale bar represents the number of substitutions per site.

