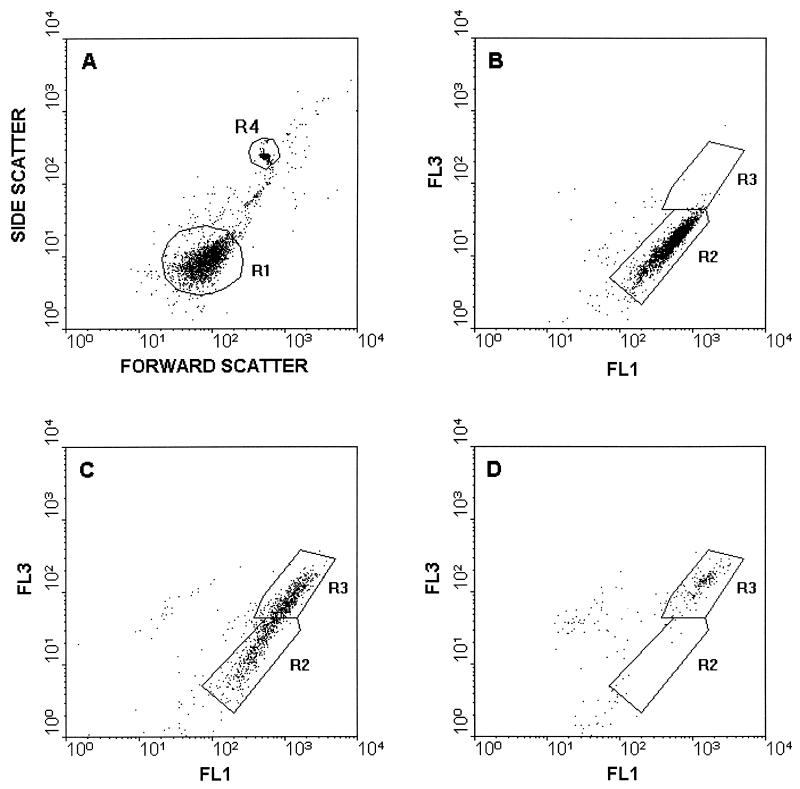
FIG. 1.
Flow cytometric analysis of serum-treated B. subtilis. (A) Light scatter histogram of B. subtilis treated with heat-inactivated serum. (B through D) Fluorescence histograms of viability-stained B. subtilis after 90 min of incubation with 0 μl of human serum per ml (B), 5 μl of human serum per ml (C), and 6.7 μl of human serum per ml (D). The standard beads were gated in R4. Cells inside R1 are shown in panels B to D. Green fluorescence (FL1) and red fluorescence (FL3) were determined by using 525- and 620-nm band pass filters, respectively.

