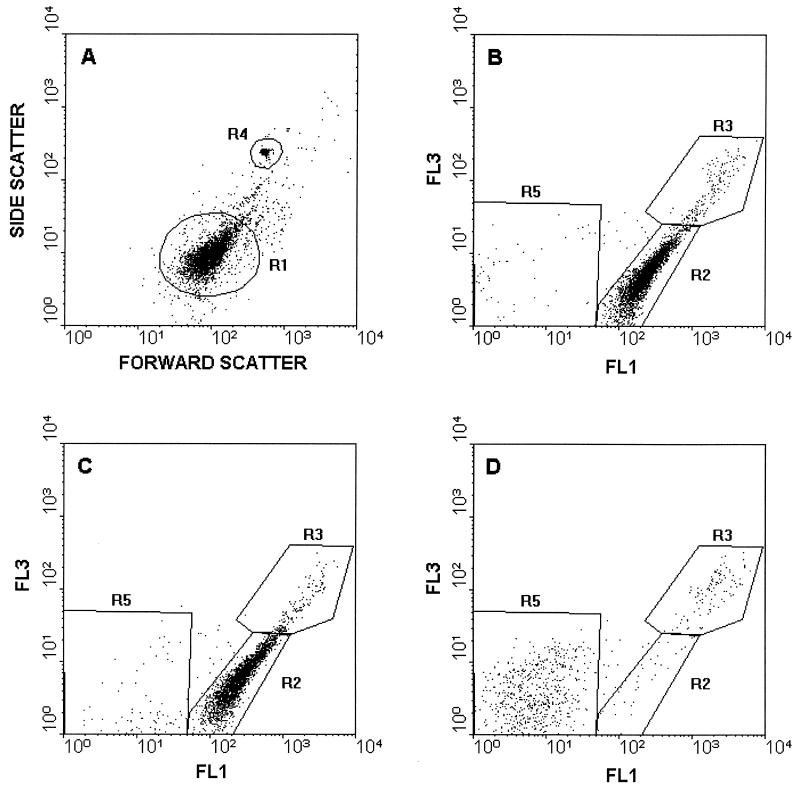
FIG. 2.
Flow cytometric analysis of serum-treated E. coli. (A) Light scatter histogram of E. coli treated with heat-inactivated serum. (B through D) Fluorescence histograms of viability-stained E. coli after 90 min of incubation with 0 μl of human serum per ml (B), 10 μl of human serum per ml (C), 12.5 μl of human serum per ml (D). The standard beads were gated in R4. Cells inside R1 are shown in panels B to D. Green fluorescence (FL1) and red fluorescence (FL3) were determined by using 525- and 620-nm band pass filters, respectively.

