


Figure 4.
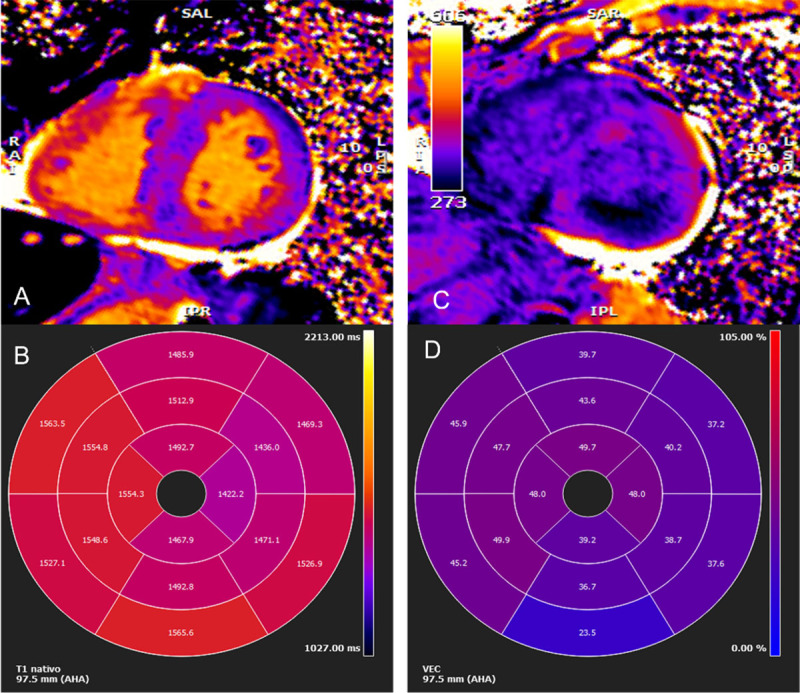
Cardiac magnetic resonance imaging. (A) Myocardial native T1 mapping (short axis) (B) Native T1 global polar map with abnormally increased T1 relaxation time (myocardial T1 values: 1,512±72 ms) (C) Post-contrast T1 (D) Global extracellular volume map, calculated from both native and post-contrast T1 myocardial values: in this case high above normal: 44±9%. (Images courtesy of Lusíadas Hospital, Lisboa, Portugal).