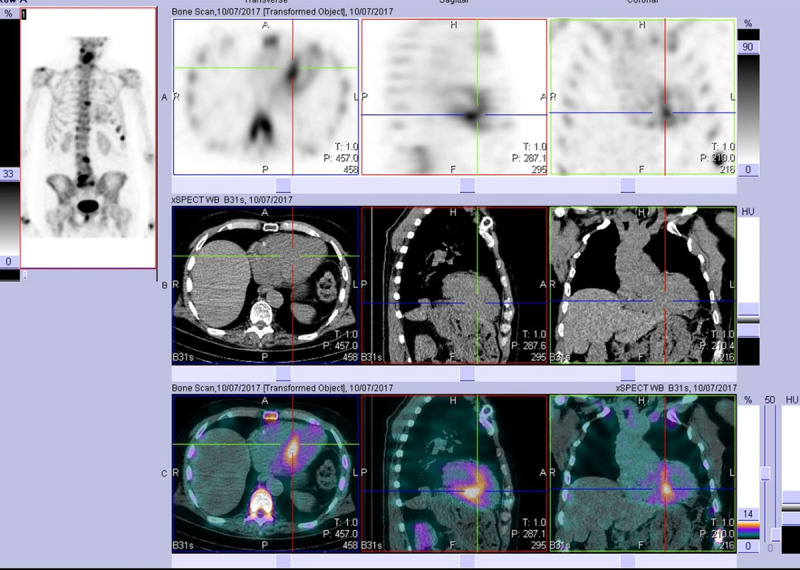
Figure 9.

After viewing the planar study, a SPECT-CT was performed. This representative slice in axial, sagittal, and coronal plains (top row = SPECT, middle row = CT, bottom row = merged) confirms the uptake as cardiac and not blood pool. Echocardiogram at the time was normal. The patient developed echo and clinical features of cardiac ATTR amyloid approximately two years later. (Images courtesy of Cabrini Health, Victoria, Australia).
